This blog post describes a neat example of some cool SAS capabilities, and also teaches you a little more about the state where SAS software is made...
Here at the SAS headquarters in Cary, NC, the main TV news channel is WRAL TV5. And my favorite segment during the news is Scott Mason's Tar Heel Traveler - he goes around the state doing stories that show a lot of heritage, tradition, and generally interesting things about North Carolina.
The WRAL site has a list of all the stories by month (here's a screen-capture of a portion of the list)...

But I wanted to be able to search for stories geographically. For example, if I was going to the Outer Banks, I thought it would be neat to view all the stories from that area before my trip.
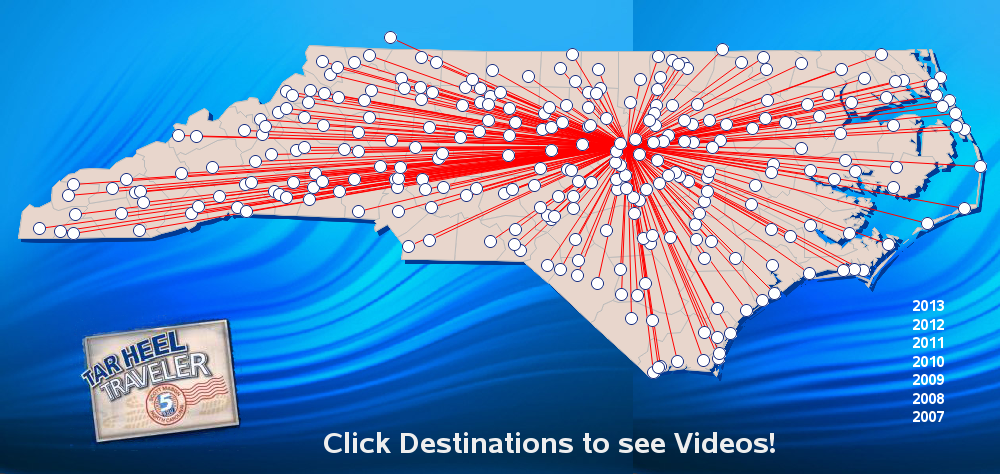
Therefore I used SAS software to create an interactive map-based interface to all the stories (click the snapshot below, to see the interactive map). I invite you to try out this map, and randomly view a few of the stories ... but I'll warn you ahead of time that it can be addicting! You'll learn some interesting things about the state where SAS software is made (in the stories), as well as see some cool capabilities of SAS software (by trying out the interface).
And now for the important question ... did you find any 'interesting' Tar Heel Traveler stories? (feel free to mention which story is your favorite, in a comment!)
Technical Details:
The main portion of this interface is a map created with Proc Gmap, and then circular (pie) markers annotated on the map. To determine the location of the markers, I took the name of the city mentioned in each story, looked up the zip code for each city, and then used Proc Geocode to determine the latitude & longitude of the cities. I also used annotate to draw a line from each city to Raleigh (where WRAL is headquartered).
When you hover your mouse over the markers on the map, you see the title of the story from that city. If a city has 1 story, I add an html drill down link to the URL for that story. But if the city has more than one story, I have the html drill down go to a list of the stories for that city (using the city name as the 'anchor' in the URL), and then the story names in the list are encoded with URL links to take you to the actual stories. I used a 'data step' with 'put' statements so I could create the table exactly like I wanted, with the html anchors a lot of blank lines between each city (so that when you drill down a city, you only see the lines for that one city).
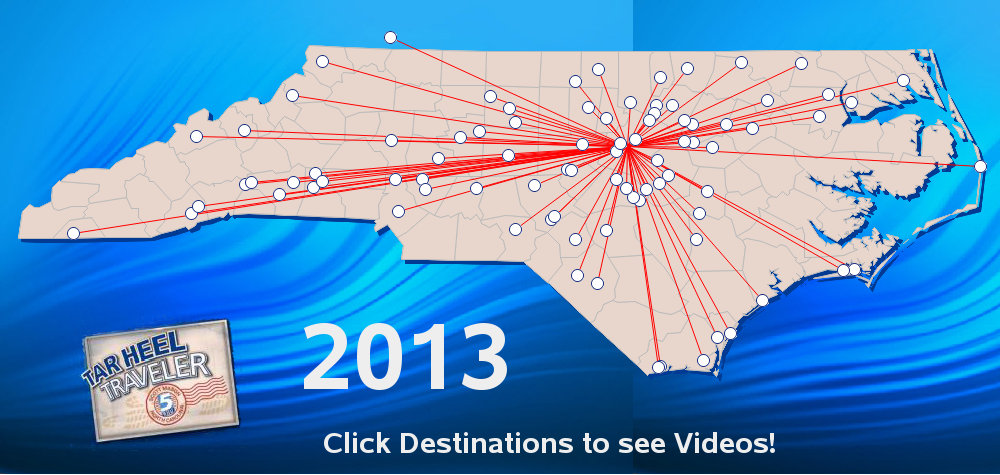
After several years, the map was getting a bit crowded with so many stories, therefore I decided to also create a separate map for each year - this makes it easier to see "what are the latest stories I might not have seen yet?" I annotated year numbers along the right-side of the main map, and set up html drill down links on each year. Now you can click a year to see just that year's stories (for example '2013')...
And a few extra features illustrated in this example ... The iback goption was used to place the blue background image behind the map. The Tar Heel Traveler logo was placed in the bottom/left of the map using the annotate image function. And the 'shadow' effect was placed behind the map using an annotated polygon. This example shows many useful SAS capabilities you might not have seen before. I invite you to download the SAS code if you want to see exactly how to code a map-based interface like this!


8 Comments
Thanks Rob. Now I am able to produce a graph like yours using my own ambulance road data! It looks great. I am also going to combine some of the tricks in your "turtle" example to display the "statistics" when mouse is hovering on the dot.
Great post!
Hi, Rob!
I got the correct picture just before I give up! This is an awesome piece of code. I am planning to use it to display Trips of Road Ambulance. My manager should be very happy about it.
One more question. For my own dataset, the Long/Lat has already been projected, so can I omit the "proc gproject" then directly combine the two projected dataset together?
Thanks
Ali
You must project the map and the annotated markers using the same projection parameters. If you project them together at the same time, then that's guaranteed. Otherwise (assuming you're running a recent version of SAS which has this new capability) you have to save out a special dataset when you project the map (using parmout= option), and then use that dataset when you project the markers (using parmin= option). Here's an example where I do that: http://robslink.com/SAS/democd70/missing_aircraft_info.htm
Hi, Rob,
I run your code in SAS EG. But got this error when I using proc gproject:
14 GOPTIONS ACCESSIBLE;
15 proc gproject data=combined out=combined dupok project=hammer;
16 id state county;
17 run;
NOTE: The HAMMER projection is experimental.
ERROR: At least one value is out of range for polar radian coordinates. Data might already be projected.
ERROR: Expected range is (-3.141592654, 3.1415926536) for X and (-1.570796327, 1.5707963268) for Y.
ERROR: Actual range is (1.317159425, 26185.741756) for X and (0.5914029146, 1803.0752205) for Y.
NOTE: The SAS System stopped processing this step because of errors.
Any clue?
Thanks
Ali
Ali,
I think I will need more information. Are you running my code as-is, or have you made changes? (I see you have added 'GOPTIONS ACCESSIBLE', so I'm assuming perhaps you've made other changes as well?)
I would recommend first trying my code with no changes, outside of EG ... and then trying running it insdie of EG (which might require removing my hard-coded 'ods html' statements) ... and then once you've got it running, then try applying your changes.
Hi, Rob,
I think am using a different US country file than you are. The one I used is a "projected" maps. So the error message tells me it is already projected. Could you do a proc contents to show me what variables are in your dataset? I will download that version from support.sas.com.
Thanks
Ali
Use the exact same sas map name that I use in my code (it is one that ships with SAS). You must use an unprojected map in order to line up the annotated unprojected lat/long coordinates on the map, etc.
Rob,
Thanks. After I change the dataset to be countries, I am able to run proc gproject.
Still have errors when draw maps, will dig more tomorrow.
Thanks!