Last night, here in the U.S., an outbreak of deadly tornadoes tore across several states. Unfortunately, nobody knows how to predict a tornado with certainty, but let's brainstorm on how SAS Software can help analyze the data in the aftermath of a natural disaster like this...
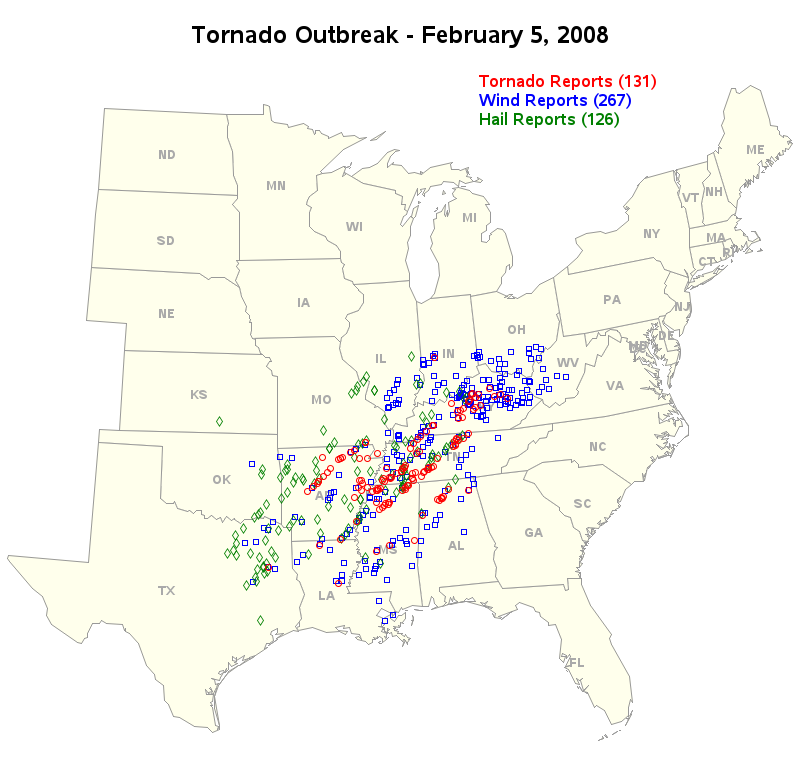
Being a graph guy, the first thing that comes to mind is showing the locations of the storms on a map. The data for the latest tornadoes isn't available yet, but here's a map showing the Super Tuesday tornado outbreak of February 5, 2008 (modeled after a NOAA map):
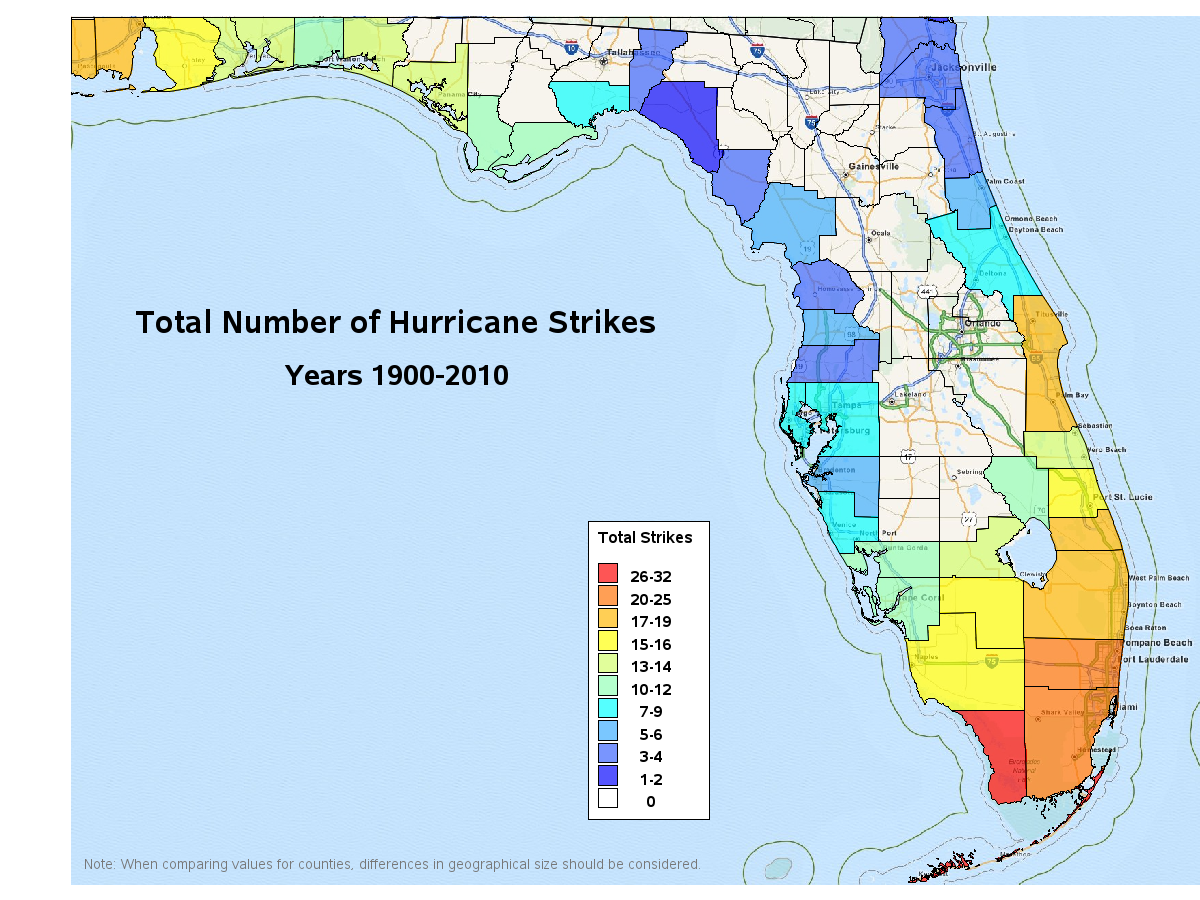
And once the damage reports are in, how about a SAS county map, shaded by the amount of damage, overlaid on top of a street map, similar to this one showing hurricane strikes in Florida (modeled after a NOAA map):
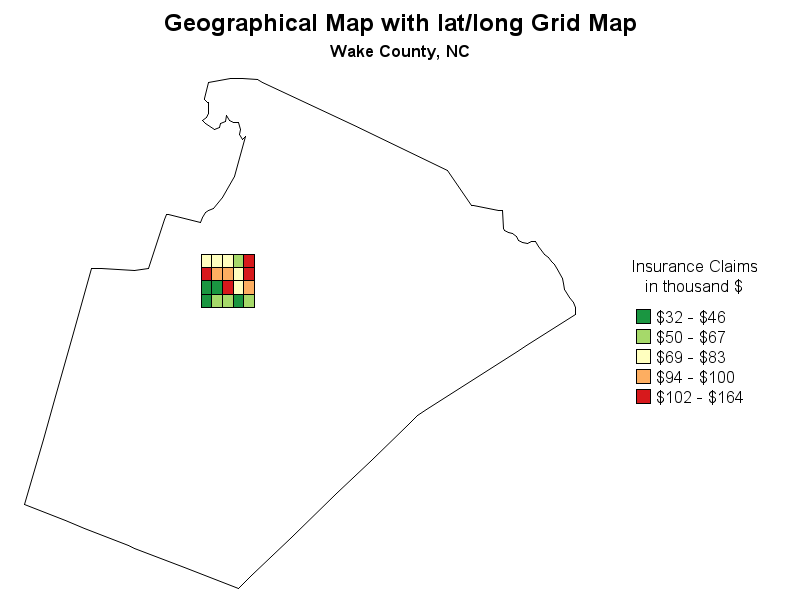
Or perhaps something even more detailed, such as using SAS to overlay a grid on a county map, using colors to represent the amount of damage within each grid cell:
What other specific ways do you think SAS Software might could be used in helping people after a natural disaster like this? (maybe logistics or managing data?) Share your ideas in the comments section!


6 Comments
Hi, The Grid cells would fit in the middle of the map even with an annotation, but what about the borders? how do you get them to merge with the map lines that are not straight?
Thanks,
As long as you start with lat/long coordinates, and project them the same way, you can 'merge' (overlay) annotations and map borders and they will line up correctly.
How can you use different markers on a map graph? I'm using JMP 11 and it seems impossible to me... btw Great chart!
Basically, you can use any font character as a map marker in SAS - When you annotate markers on a SAS/Graph map, you can use the annotate 'label' function, and then specify any font on your pc (using the 'style' variable), and then specify the hex code for the character in the 'text' variable.
Wow that sound pretty advance to me! I'm a beginner user and I've been doing maps graphs using JMP(quite easy..) Today I tried to build it in SAS but i couldn't... I made a query with the world map table but when i configured the graph didn't recognize the countries shapes... Do you know what I'm doing wrong? 1000 thx!
Hmm ... it's really difficult to determine what the problem is, with the information you have provided.
I would recommend posting your question (and more details about what you tried - hopefully including the SAS code) to the SAS Graph Communities forum:
https://communities.sas.com/t5/SAS-GRAPH-and-ODS-Graphics/bd-p/sas_graph