In the Breaking Bad TV series, Walter White has an impressive lab where he secretly makes the illegal drug methamphetamine (meth). Wouldn't it be cool to use SAS to show the locations of all the clandestine meth labs in the US?!? Let's do it!...
In this blog, I show you how to plot the locations of the 'clandestine labs' (mostly meth labs) listed on the U.S. Drug Enforcement Administration (DEA) website ... and as a bonus, I even show you how this process discovered some 'bad data' in the list.
The DEA has a Web page where they list all the clandestine drug labs by state. I went to this page and downloaded the list for North Carolina.
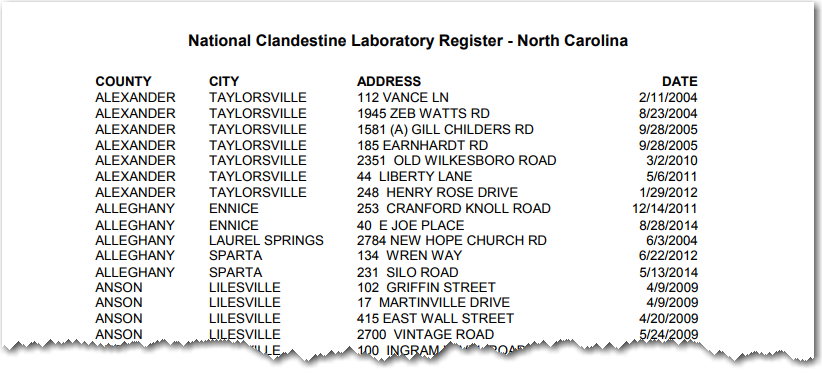
SAS can't import PDF files directly, so I copy-n-pasted the data into a text file, and then imported it into SAS. Since the DEA data contains the county names, it was a simple matter to produce a map (using Proc Gmap) showing the summary count of the number of meth labs per county. I had to manually resolve one county spelling difference - the DEA list used the spelling 'McDowell' (no space), whereas the spelling in SAS' maps.cntyname is 'Mc Dowell' (with a space).
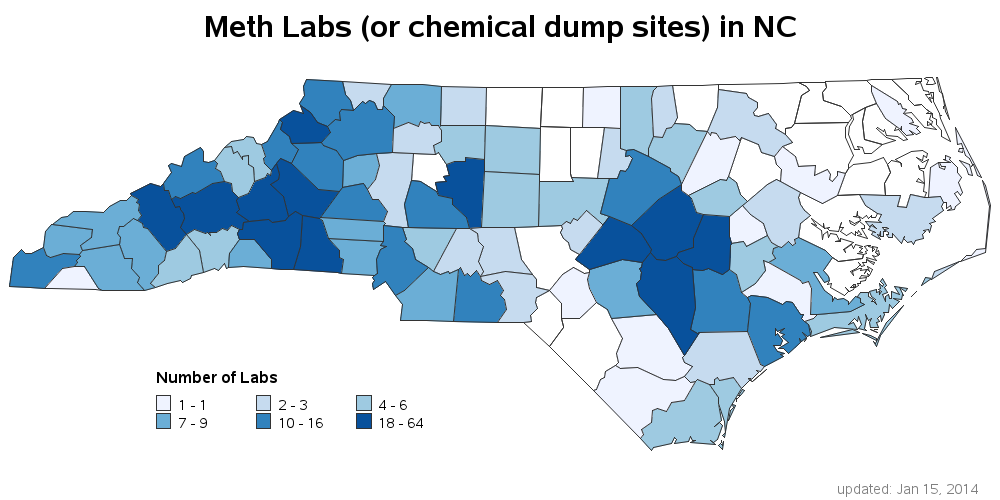
The above choropleth map really helps get a much better geographical grasp on the data than the text list, eh?!? But the text list does go to a bit finer detail than is shown in the county map - the text shows the actual street addresses. Therefore, to take advantage of the all the level of detail provided in the data, we can use Proc Geocode to estimate the latitude and longitude of each clandestine lab, and then plot markers on the map.
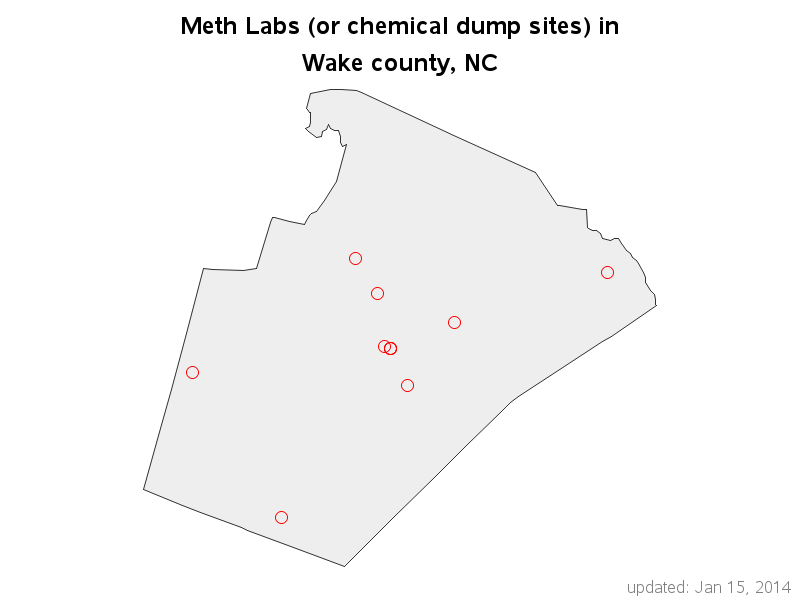
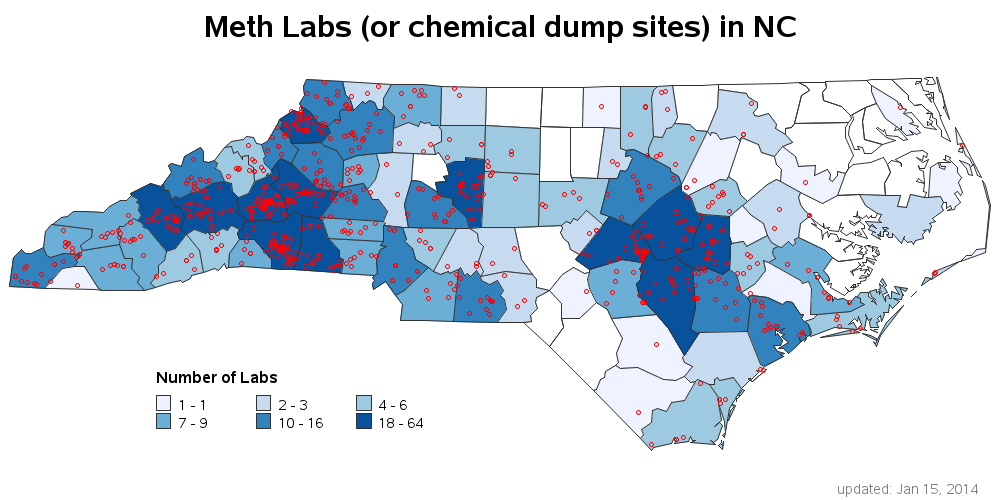 Now we're representing all the data, to the full level of detail ... but some of the markers are a bit crowded. Therefore, to help see the individual data points better, I provided one level of drill down. You can click on each county to see just that one county, and then click on the indivudual markers to see a Google satellite map zoomed-in on that street address. For example, below is the map for Wake County (location of SAS headquarters). Pretty cool, eh?!? :)
While working with this data, I noticed there was one county that did not have a match in maps.cntyname - Missoula County, NC. And also when I was geocoding the street addresses, I noticed that 355 COLORADO ST 10, East Missoula, NC would not geocode. I did a bit of research, and came to the conclusion that there was not a Missoula County, nor an East Missoula City, in NC. I suspect this address should actually be in the Montana list, and the DEA is checking into that - isn't it great how plotting data with SAS can help uncover 'bad data'?!? :)


7 Comments
Rob,
this is a great idea. The red dots give a good sense of the density of the labs per county. However, I am not familiar with NC geography so I wonder are the labs clustered near population centers (where the market is) or are they out in rural areas (where police presence is lower)? Can you color the NC county according to population density using Census data?
Thanks!
Here's a shaded choropleth map of the NC population by county:
http://robslink.com/SAS/democd56/county_population_nc.htm
And here's a little more detailed map of population by census block:
http://robslink.com/SAS/democd64/census_block_map.htm
Thanks, Rob,
from reviewing the 2 graphs, I would say that the labs are clustered around the counties of higher population density, except for Buncombe which seems to have a high density of both.
Is there a link to look at the code? Usually it is at the end of the article but I do not see it.
Here's a link to the code: http://robslink.com/SAS/democd69/meth_labs_info.htm
Thanks
Oh, and 1 more sas job, if you want to see how all the county drilldown maps were created: http://robslink.com/SAS/democd69/meth_county.sas