Michele Ensor recently posted a wonderful blog with a graph of the 2014 Winter Olympics medal count. I'm going to further refine that graph, making it an Olympic graph ... on steroids! :)
Here is Michele's graph:
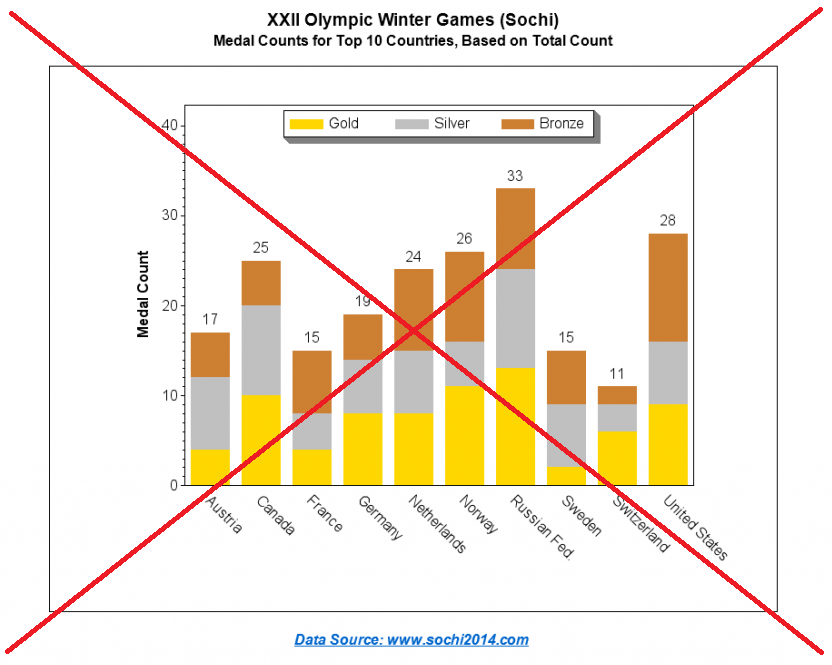
First, let's give it a few simple cosmetic changes.
I always like to have the titles and footnotes inside the graph border (which also makes them part of the image, making it easier to copy around), therefore I use ods html, device=png, and gtitles (rather than nogtitles). I also like to leave out the minor tickmarks on the axis (minor=none), and leave off the axis frame on the top & right sides (noframe). Or, as Henry David Thoreau says, "Simplify, simplify, simplify."
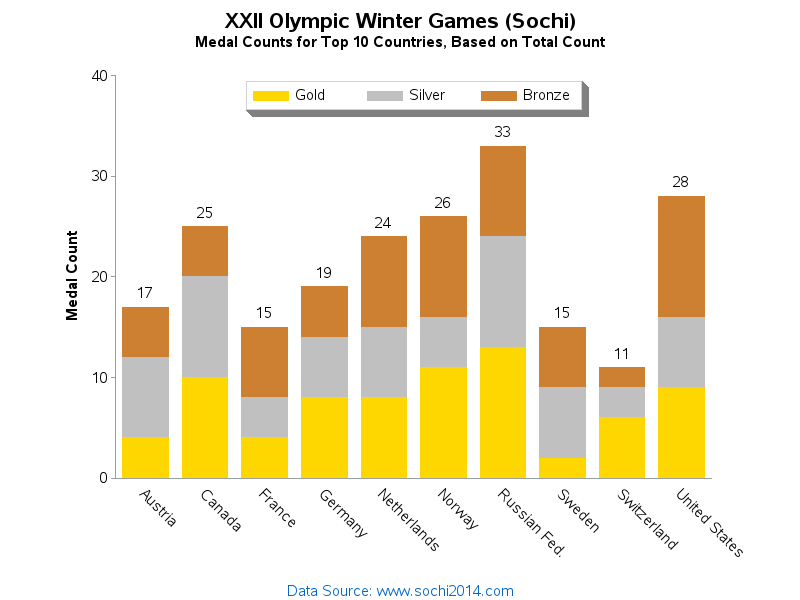
I don't always take things away from graphs. Sometimes I actually recommend adding things, if it helps make the graph more useful. With this particular graph, I foresee people wanting to know "exactly how many gold medals did France win?" It's difficult to tell by just looking at the chart. There's a total at the top of each bar (outside=sum), but let's also add the counts for each individual bar segment (inside=sum). Now we can easily tell that France had four gold medals.

Well, that's about it for the simple changes, via simple options and such. Now let's do some "heavy lifting" - things that require trickier techniques such as manipulating the data, and creating user-defined-formats.
In the original graph, there was also a table of the data, and that table was sorted by the number of gold medals won by each country. I really liked seeing the data sorted in that order, but there is no easy way to sort a bar chart that way. You can easily sort the bars by the total height, using the descending option, but there is no easy way to sort them by just one of the bar segments (such as gold medals).
As a work-around, I programmatically assigned a numeric value (bar_order) to each country based on the number of gold medals, and plotted by that variable rather than the country name - now the bars sort in the order of that numeric variable, rather than by the alphabetic country name. I similarly assigned numeric values to the gold, silver, and bronze values (stack_order) to control the stacking order of the colored bar segments. Now the bars are ordered as desired, and the colored segments are stacked as desired...
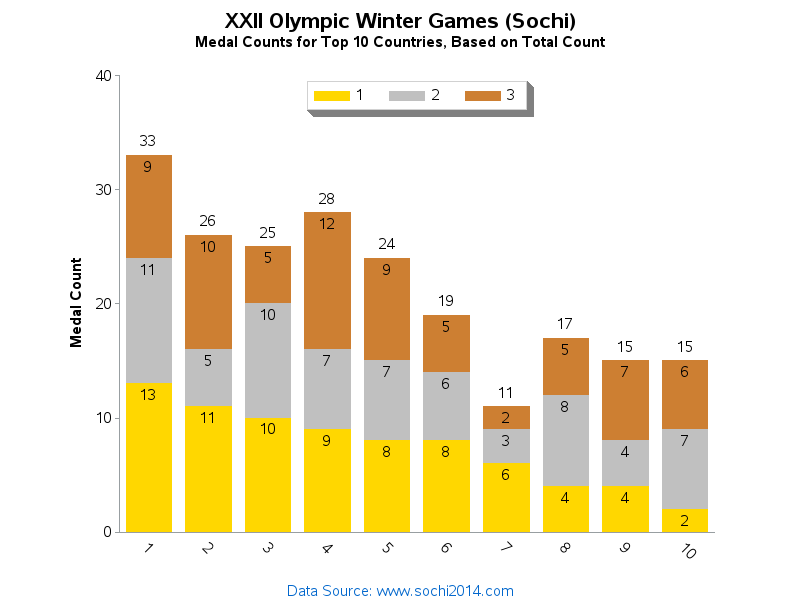
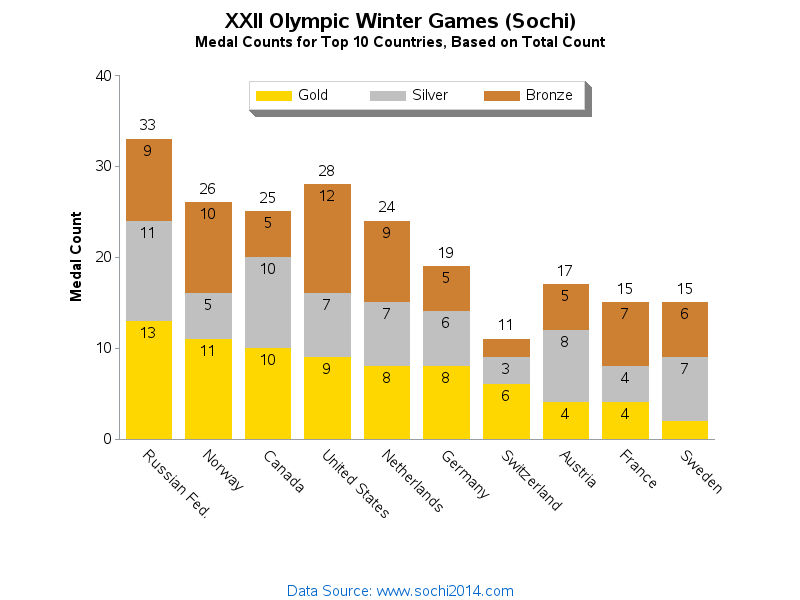
... but we don't really want to see those numeric values - we want to see the country names below the bars, and the medal colors in the legend! To have it both ways - sorted based on the numeric values, but 'printed' as the desired text, we can dynamically generate user-defined-formats (based on the values in the dataset). Our graph will then be "on steroids!"
proc sql;
create table foo1 as select unique bar_order as start, country as label from standings;
quit; run;
data control; set foo1;
fmtname = 'barfmt';
type = 'N';
end = START;
run;
proc format lib=work cntlin=control;
run;
proc sql;
create table foo2 as select unique stack_order as start, medal as label from standings;
quit; run;
data control; set foo2;
fmtname = 'stkfmt';
type = 'N';
end = START;
run;
proc format lib=work cntlin=control;
run;
Here's a link to the full sas code if you'd like to download it and experiment. Hopefully you'll be able to adapt these tricks, and put your own graphs 'on steroids!'


2 Comments
I really like the way you customized the graph. It seems much clearer now. I have one question, however. In the stacked bars for Switzerland and Sweden there is a 2 missing; from the bronze medal count in the Switzerland bar and the gold medal count in the Sweden bar. What happened?
Sharp eye, Patrick!
This is a feature of Gchart - if the bar segment becomes too small to print the label in, Gchart leaves out the label. In the graphs above, when I had numeric values for the bar labels there the bar segments were taller and the number could fit, but when I switched to long text labels the bar segments were smaller and those 2 values were omitted.
In this particular case, the omitted values can still be intuited by doing a quick math calculation with the numbers that are shown (Sweeden's gold medals = 15-(6+7) ... = 2). One work-around would be to make the graph taller (such as 'goptions ypixels=700;') so that there will be more room for the numbers. Or to guarantee that the numbers are always printed on every bar segment (regardless whether they overlap or not, etc) you could annotate them.
Hope this info helps, and thanks for looking at my blog!