A big part of "winning" these days (be it sports or a business) is performing analytics better than your competition. This is demonstrated in awe-inspiring fashion in the book (and movie) "Moneyball." And on that topic, I'd like to show you a few ways SAS can be used to analyze sports data ...
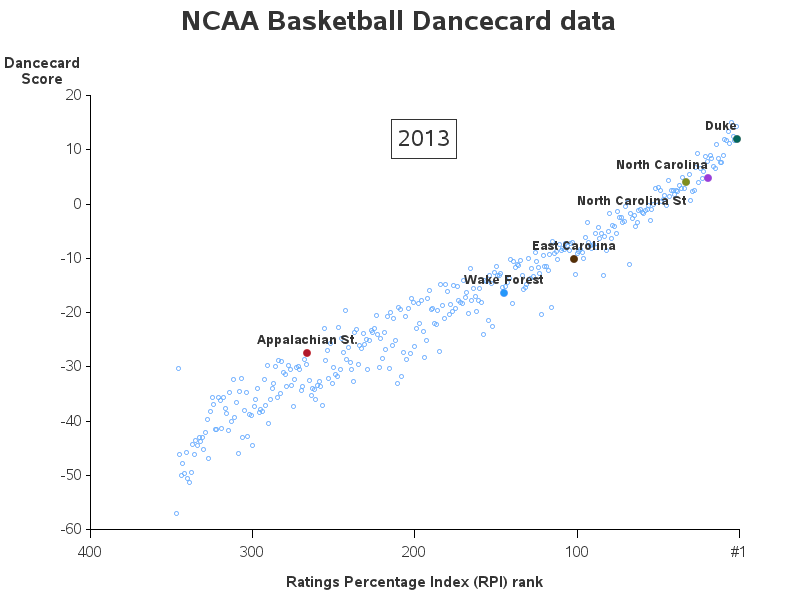
If you're a U.S. college basketball fan, you've probably heard of the professors who use SAS to forecast which teams will go to the NCAA tournament (they call this list the "Dance Card"). Their results are in a tabular form, but I thought it might be useful to see them as a scatter plot (with my favorite teams of interest highlighted). Click the snapshot below to see the gif animation:
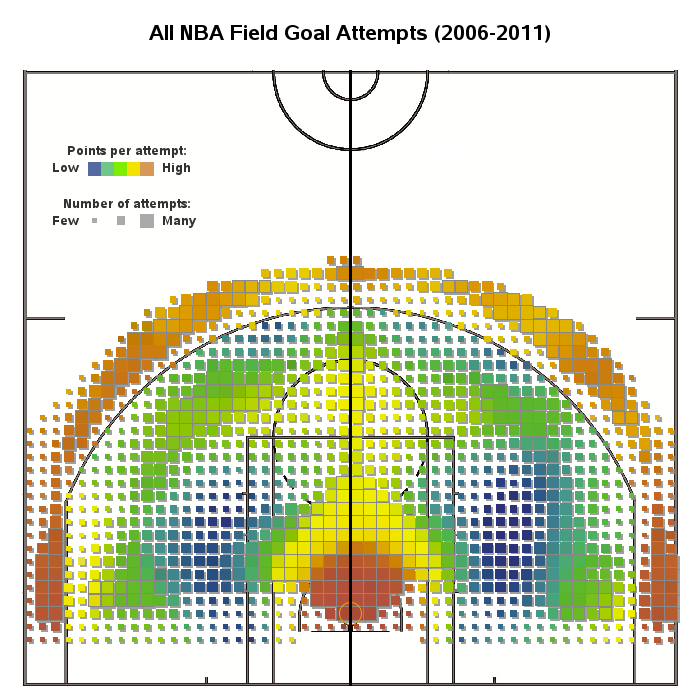
How about NBA basketball?!? ... Someone sent me a link to a visually captivating example from Flowingdata.com, showing where on the basketball court the most points-per-attempt are made. With a little custom work, I was able to create a similar map using Proc Gmap:
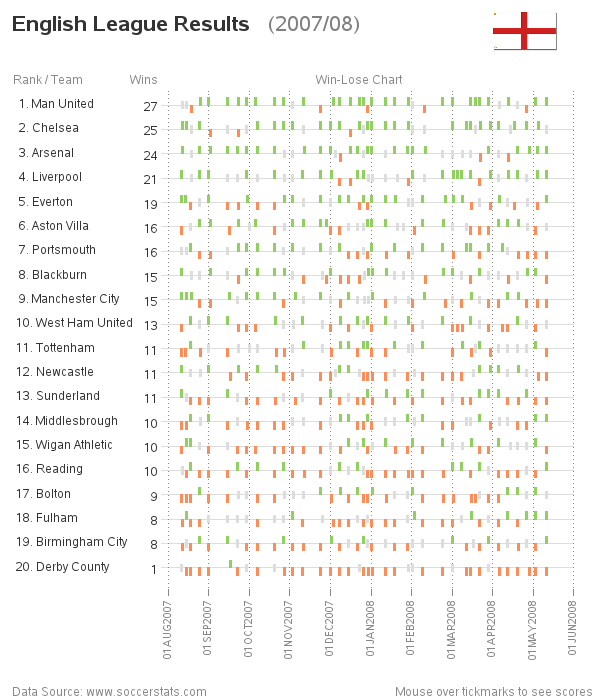
Now, maybe for a sport with a little more worldwide appeal - soccer! I found an interesting win/loss chart on the bonavistasystems website, and was able to create a very similar win/loss chart in SAS/Graph:
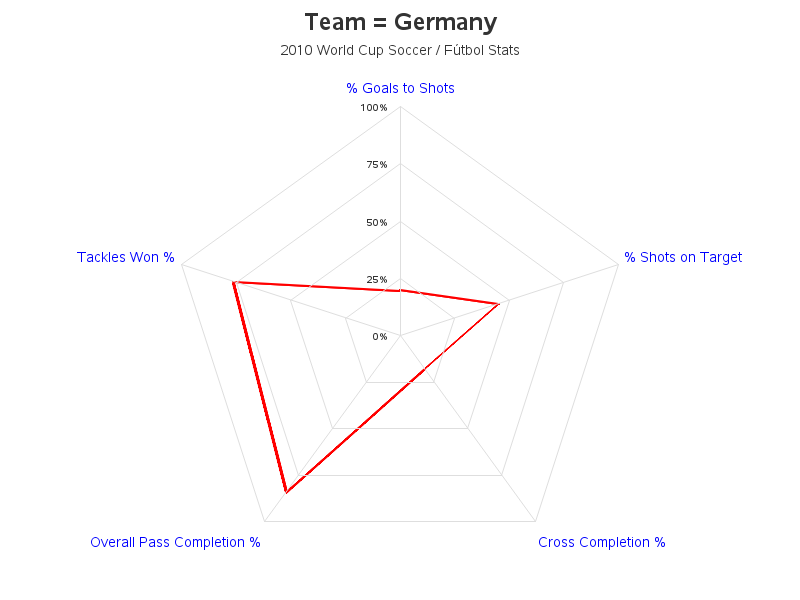
And if you're a soccer fan, perhaps you would like to see radar charts used to visualize & compare five key factors for the World Cup soccer teams?!? ...
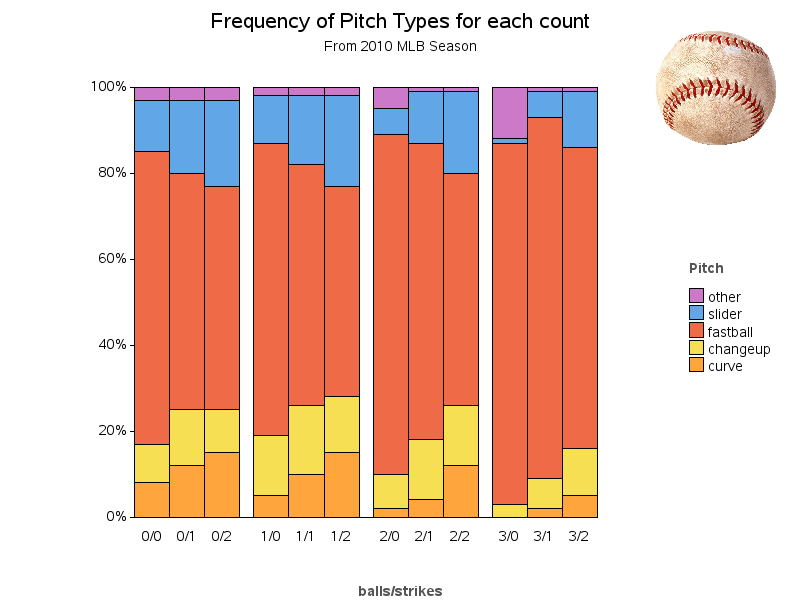
Or maybe you're more of a baseball fan? ... I saw a fancy 3d chart in the ESPN Magazine - it was 'interesting' but very difficult to see what the data was doing. I came up with a more straightforward SAS/Graph chart which I think does a much better job at visualizing the data:
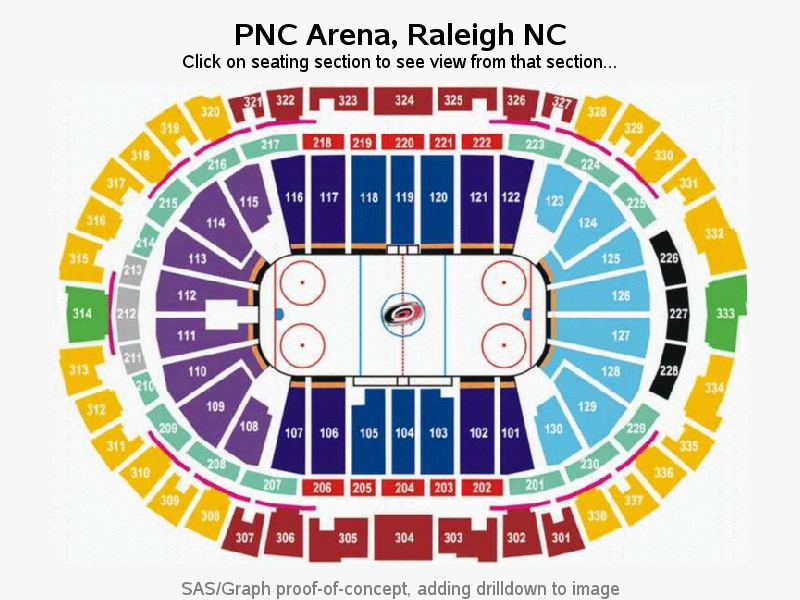
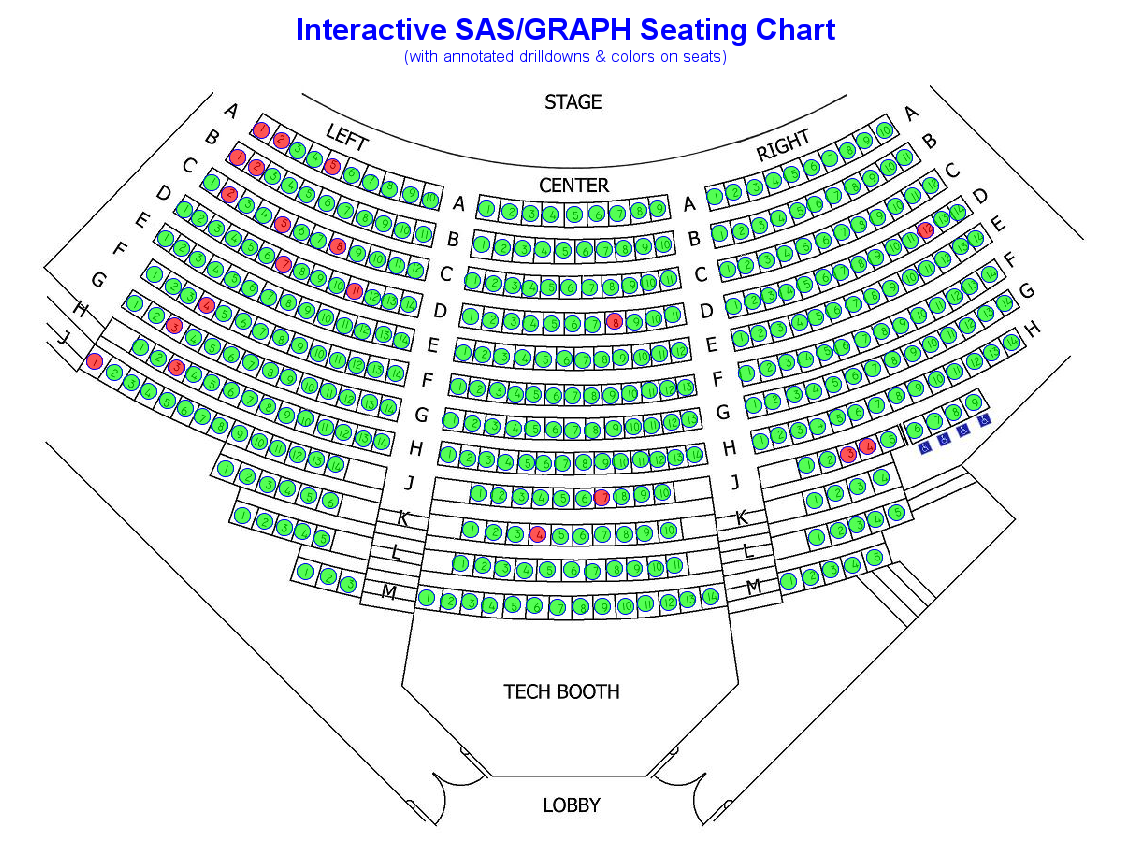
Or, how about a stadium seating chart, with an overlaid grid of mouse-over text and drill down links to correspond to the seats? You could also overlay colored dots showing whether the seats had been sold (see 2nd graph below).
As you can see, there are a lot of "visual analytics" SAS can apply to sports-related data. What sports data do you think would be cool to analyze in SAS, and what approach would you (hypothetically) take? ...
Details:
If you'd like to see the SAS code or more details about any of the examples shown above, here are the links: NCAA Basketball, NBA court, England soccer, World cup soccer, MLB pitching, Stadium seating, Seating chart.


3 Comments
Pingback: Analytics, and winning soccer (fútbol) teams! | The SAS Training Post
I plan my vacations around the MLB schedule and I use baseball-roadtrip.com to do so. I would love to try doing this using SAS OR. Actually, come to think of it, I would like to know if any major sport uses SAS for their scheduling purposes.
I would not be surprised if a major sport uses SAS for scheduling ... but I cannot confirm or deny that! :)