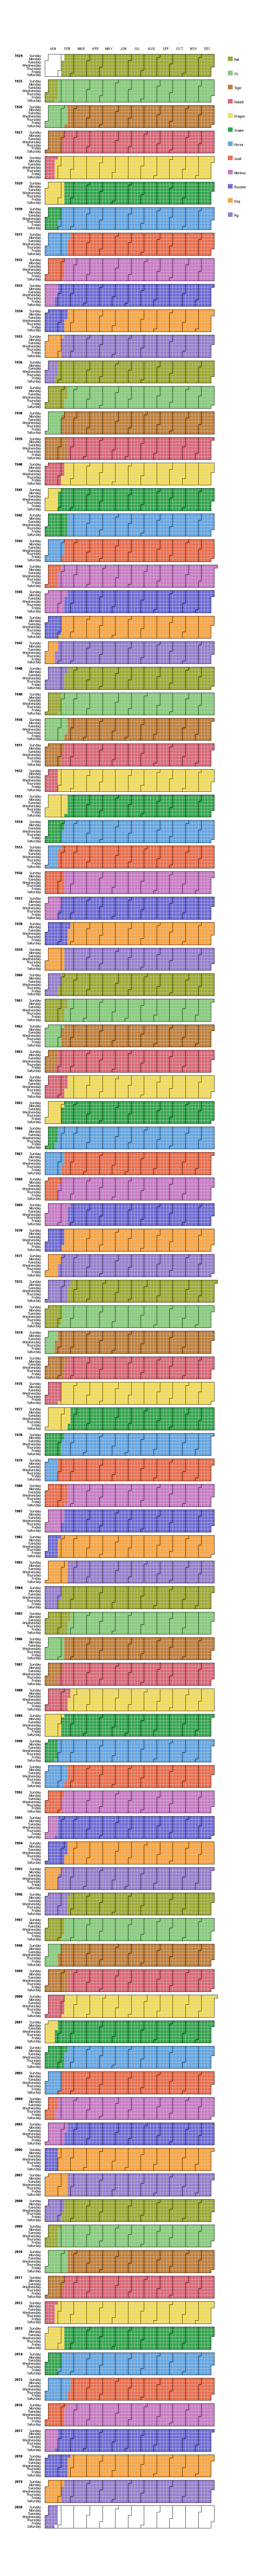
I like to think that I have a graph for all occasions - Chinese New Year is no exception! ...
The exact date of the Chinese New Year varies from year to year, because it's based on the lunar (moon) cycles. I thought it would be useful to create a calendar chart, so I can easily see when each Chinese Year starts and stops (in past & future years).
While searching for the start/end dates of the Chinese Years, I found a table in Wikipedia which had that info, along with the Chinese Zodiac sign for each year - so I thought it would be neat to include that in the calendar chart also :)
Whereas the "Western" Zodiac has 12 different characters/animals in a year, the Chinese Zodiac has 1 animal per year, on a 12 year cycle. Year 2012 was the year of the dragon (which is my sign), and 2013 was year of the snake, for example.
Once I got all the values into a SAS data set (see the code), I simply re-used the code for my custom Proc Gmap calendar chart (explained in Example 17 of my book), and colored the calendar days based on the Chinese Zodiac animal (see below). Note that this is a *very* long/tall chart (8,000 pixels tall), with the older years at the top, and the modern/current years at the bottom.
Click the link to see the complete interactive calendar, where you can hover your mouse over the boxes to see the date & zodiac animal in html mouse-over text (that version is also larger, and easier to read). In the interactive chart, try scrolling to the year you were born, find your birthdate (by hovering over the boxes and looking at the date in the mouse-over text) and then see what your Chinese Zodiac sign is (by looking up the color of that day in the color legend, or simply reading the mouse-over text).


2 Comments
Hey, Rob,
What a great graphical presentation!
Impressive!
You are sooooo good at it!
You might want to add another thing on your graph..
When I put the mouse on the cell, it shows date and year.
How about date and year by lunar year calendar?
For example, if I put mouse on Feb 10, 2013, it shows as Jan 1st, 2013, something like that.
My dad and my mom celebrate their birthday by lunar year calendar day.
I always go to google and find out what day it falls into.
And it will be interesting to see how leap year and leap month work out... (you know to correct the offset of lunar calendar, there are leap month and leap years in every certain period..
Anyway, great graph.
Loved it!
Eunice
Thanks for the nice compliments!
And that's a good idea for an enhancement ... probably not easy/trivial to do, but a great idea. I'll have to look around to see if I can find the data, or a way to calculate it with code.