Recommended soundtrack for this blog post: Netflix Trip by AJR.
This week's news confirms what I already knew: "The Office" was the most-streamed television show of 2020. According to reports that I've seen, the show was streamed for 57 billion minutes during this extraordinary year. I'm guessing that's in part because we've all been shut in and working from home; we crave our missing office interactions. We lived vicariously (and perhaps dysfunctionally) through watching Dunder Mifflin staff. But another major factor was the looming deadline of the departure of The Office from Netflix as of January 1, 2021. It was a well-publicized event, so Netflix viewers had to get their binge on while they could.People in my house are fans of the show, and they account for nearly 6,000 of those 57 billion streaming minutes. I can be this precise (nerd alert!) because I'm in the habit of analyzing our Netflix activity by using SAS. In fact, I can tell you that since late 2017, we've streamed 576 episodes of "The Office". We streamed 297 episodes in 2020. (Since the show has only 201 episodes we clearly we have a few repeats in there.)
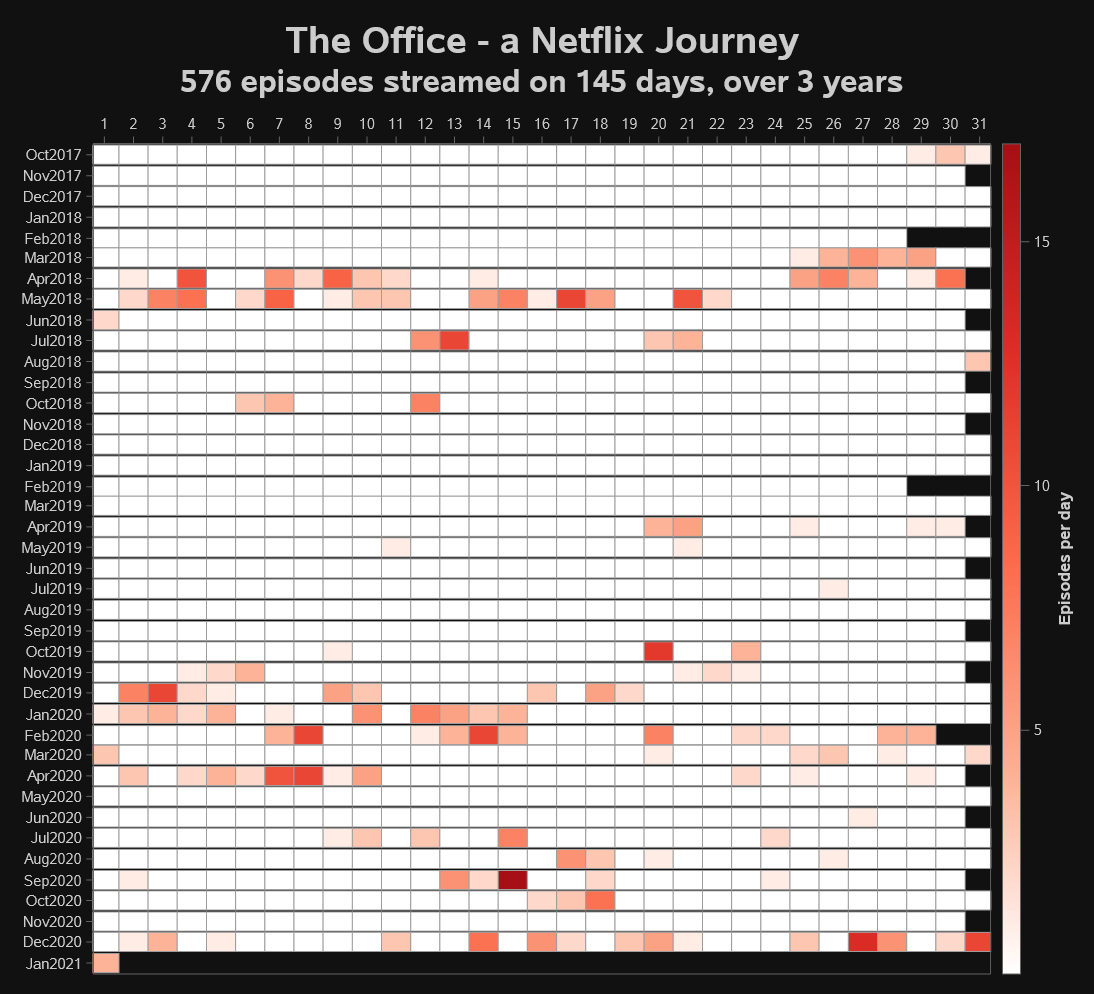
I built a heatmap that shows the frequency and intensity of our streaming of this popular show. In this graph each row is a month, each square is a day. White squares are Office-free. A square with any red indicates at least one virtual visit with the Scranton crew; the darker the shade, the more episodes streamed during that day. You can see that Sept 15, 2020 was a particular big binge with 17 episodes. (Each episode is about 20-21 minutes, so it's definitely achievable.)
How to build the heatmap
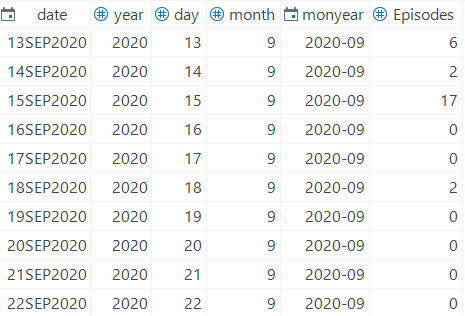
To build this heatmap, I started with my Netflix viewing history (downloaded from my Netflix account as CSV files). I filtered to just "The Office (U.S.)" titles, and then merged with a complete "calendar" of dates between late 2017 and the start of 2021. Summarized and merged, the data looks something like this:
With all of the data summarized in this way such that there is only one observation per X and Y value, I can use the HEATMAPPARM statement in PROC SGPLOT to visualize it. (If I needed the procedure to summarize/bin the data for me, I would use the HEATMAP statement. Thanks to Rick Wicklin for this tip!)
proc sgplot data=ofc_viewing; title height=2.5 "The Office - a Netflix Journey"; title2 height=2 "&episodes. episodes streamed on &days. days, over 3 years"; label Episodes="Episodes per day"; format monyear monyy7.; heatmapparm x=day y=monyear colorresponse=episodes / x2axis outline colormodel=(white CXfcae91 CXfb6a4a CXde2d26 CXa50f15) ; yaxis minor reverse display=(nolabel) values=(&allmon.) ; x2axis values=(1 to 31 by 1) display=(nolabel) ; run; |
You can see the full code -- with all of the data prep -- on my GitHub repository here. You may even run the code in your own SAS environment -- it will fetch my Netflix viewing data from another GitHub location where I've stashed it.
Distribution of Seasons (not "seasonal distribution")
If you examine the heatmap I produced, you can almost see our Office enthusiasm in three different bursts. These relate directly to our 3 children and the moments they discovered the show. First was early 2018 (middle child), then late 2019 (youngest child), then late 2020 (oldest child, now 22 years old, striving to catch up).
The Office ran for 9 seasons, and our kids have their favorite seasons and episodes -- hence the repeated viewings. I used PROC FREQ to show the distribution of episode views across the seasons:
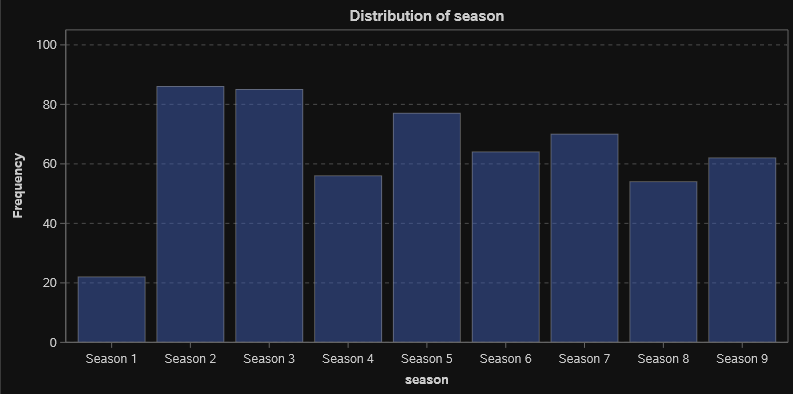
Season 1 is remarkably low for two reasons. First and most importantly, it contains the fewest episodes. Second, many viewers agree that Season 1 is the "cringiest" content, and can be uncomfortable to watch. (This Reddit user leaned into the cringe with his data visualization of "that's what she said" jokes.)
From the data (and from listening to my kids), I know that Season 2 is a favorite. Of the 60 episodes we streamed at least 4 times, 19 of them were in Season 2.
More than streaming, it's an Office lifestyle

Office fandom goes beyond just watching the show. Our kids continue to embrace "The Office" in other mediums as well. We have t-shirts depicting the memes for "FALSE." and "Schrute Farms." We listen to The Office Ladies podcast, hosted by two stars of the show. In 2019 our daughter's Odyssey of the Mind team created a parody skit based on "The Office" (a weather-based office named Thunder Mifflin) -- and advanced to world finals.
Rarely does a day go by without some reference to an iconic phrase or life lesson that we gleaned from "The Office." We're grateful for the shared experience, and we'll miss our friends from the Dunder Mifflin Paper Company.

5 Comments
It might be interesting to plot your 'heatmap' by day of week - it might show that certain days tend to be "Office" days.
Funny you should say that! When Rick was helping me with some of these heatmap techniques, he played with showing weekday vs weekend viewings. Turns out that day-of-week isn't a factor for Office binging, at least in my house. Anecdotally, I can tell you my kids would often stream it in the background as they worked on other things. That's a talent they have that I do not -- if the TV is on, that's where my attention goes.
Is there a way to do this with an slightly earlier version of SAS? We have 1M2.
You mean 9.4M2? Some of the heatmap tricks (and definitely the Git functions) won't work. You could use a GTL heatmap, maybe -- more coding. But you can also run this in SAS OnDemand for Academics if you want just a free way to try it out.
I used a similar approach
https://communities.sas.com/t5/blogs/blogarticleprintpage/blog-id/saeblog-board/article-id/811/comment-id/828