In my earlier post about WHERE and IF statements, I announced that the DATA step debugger has finally arrived in SAS Enterprise Guide. (I admit that I might have buried the lead in that post.) Let's use this post to talk about the new debugger and how it works.
First, let's address some important limitations. This tool is for debugging DATA step code. It can't be used to debug PROC SQL or PROC IML or SAS macro programs. Next, it can't be used to debug DATA steps that read data from CARDS or DATALINES. That's an unfortunate limitation, but it's a side effect of the way the DATA step "debug" mode works with client applications like SAS Enterprise Guide. (Workaround: load your data in a separate step, then debug your more complex DATA step logic in a subsequent step.)
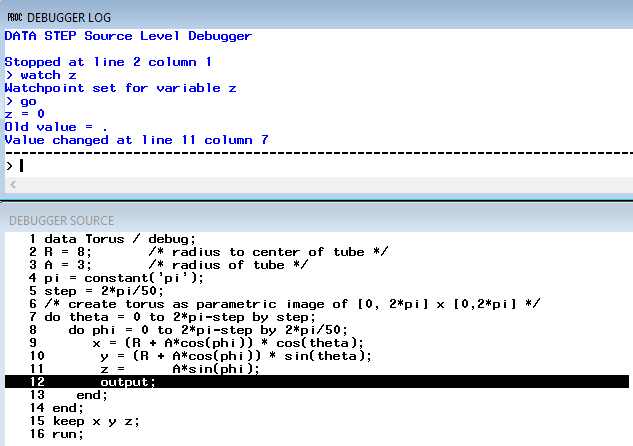
Ye olde DATA step debugger
The new DATA step debugger
The new debugging environment, introduced in SAS Enterprise Guide 7.13, has all of the features of its ancestor. And it's much more usable, with toolbars and windows that allow you to control its behavior. But keyboard junkies, don't worry -- that command line is still there too!
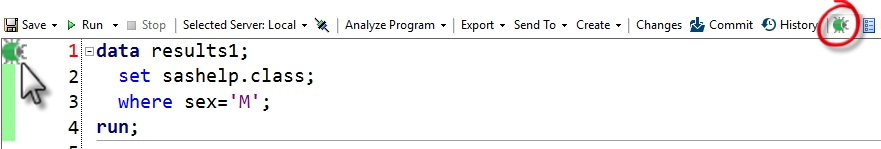
To activate the debugger, click the new "bug" toolbar icon in the program editor window. Once activated, you can click the bug in the left "gutter" of the program editor to begin a debug session. (You can also press F5 to debug the active DATA step.)
Examine the screenshot below. You see the source window on top and the console window at the bottom, plus a convenient "watch" window that shows much of the content in the program data vector (PDV). That's all of the variables defined in the DATA step, plus automatic variables like _N_ and _ERROR_.
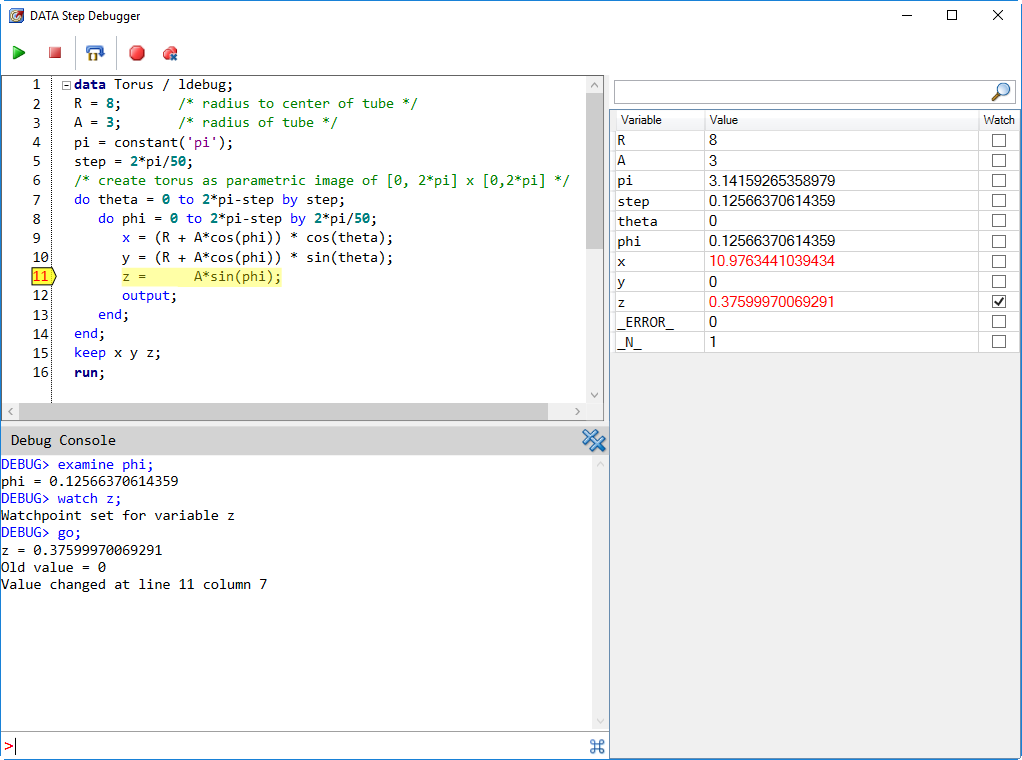
As you step through the DATA step, the line pointer in the source window advances to show the next line that will execute. You can use keyboard shortcuts (F10), the toolbar, or type a command ("step") to execute that line and advance. With every step, the watch window is updated with the latest values of the variables in your step. When a variable changes value, it's colored red. If you want to the DATA step to break processing when a certain variable changes value, check the Watch box for that variable.
Diving deeper with advanced debugging
Here's another example of debugging a different DATA step program. This program uses a BY statement and FIRST.variable logic, and you can see the additional automatic variables (FIRST.Make and LAST.Make) that the debugger is tracking. I also used END=eof on the SET statement; that adds the eof "flag" variable into the mix during run time.
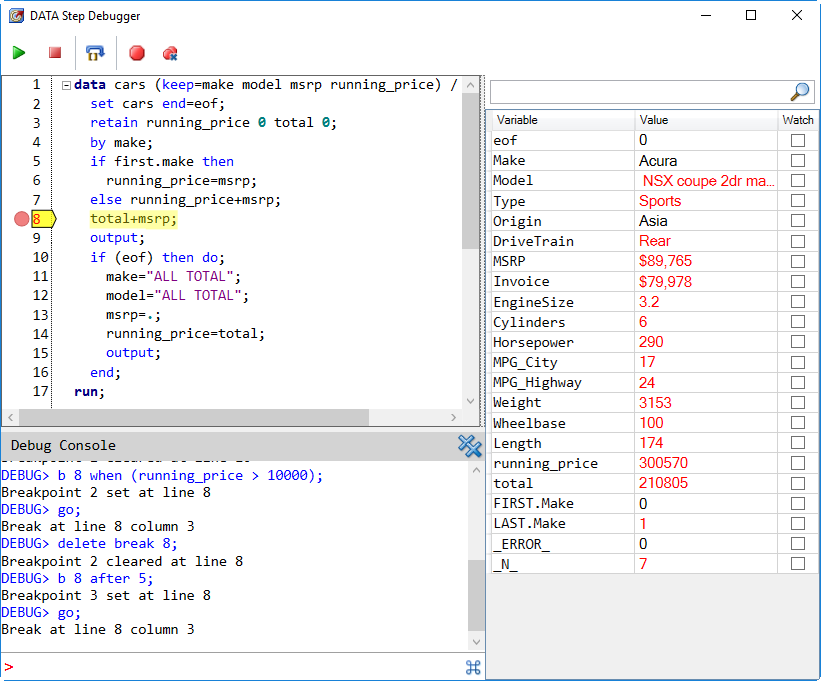
In the Debug Console window you can see that I've issued some pretty fancy commands. The DATA step debugger allows you to set breakpoints that trigger on specific conditions. For example, "b 8 when (running_price > 10000)" will break on Line 8 when the value of running_price exceeds 10,000. "b 8 after 5" will break on Line 8 after 5 passes through the DATA step. You can set and clear line-specific breakpoints by clicking in the "gutter" (that left-hand margin next to the line numbers).
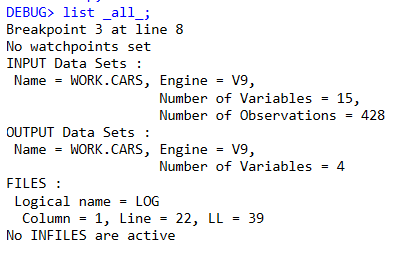
The "list _all_" command reveals the details about your open data sets and files. Here's what I see during the run of my program.
Other commands let you SET variable values, EXAMINE variables, CALCulate expressions, GO and JUMP to specific lines, and more. The SAS documentation contains a complete reference for DATA step debugger commands, and most of those work exactly as documented, even within SAS Enterprise Guide. Here's the list:
This old-but-still relevant SAS Global Forum paper (written by a SAS user) also covers some useful debugging concepts in SAS which you can apply in this new environment.
A personal note: eating my words
I've presented "SAS Enterprise Guide for SAS programmers" as a topic in one form or another for the past 15 years. Every so often the topic of the DATA step debugger comes up, and I've said "don't look for it anytime soon." Knowing how the full-screen debugger is closely tied to the SAS windowing environment, I didn't hold out hope for a client application like SAS Enterprise Guide to get it working. Kudos to the R&D team! They creatively found a solution with the "/ldebug" option, an even more obscure debugging approach that works in SAS batch mode. I think this feature will be a tremendous productivity boost for experienced SAS programmers, and a useful learning and teaching tool for those just getting started with the DATA step.

24 Comments
Nice addition! Need to teach this new feature to my customers!
Even if i've never used the old debugger, i usually prefer to build test case dataset, to evaluate the logic implemented in the code. Thanks for your articles.
Great to see the SAS Enterprise Guide DATA step debugger in more detail. Thanks Chris. Agree - Kudos to the R&D team!
I saw this post just before I was to present at our QUEST SAS user group meeting this evening and was super excited to share this with the community. Lots of positive comments during the networking session. A few people were also reflecting on your presentation at the last QUEST meeting.
"reflecting" on my presentation? Was that before or after the wine was being served? (Wait, if I remember correctly, QUEST runs their meetings the correct way: drinks first.)
Pingback: Debugging the difference between WHERE and IF in SAS - The SAS Dummy
How to update EG to the latest version without internet connection on target workstation?
Typically, you would have to contact SAS (or ask your SAS admin to do this) and refresh your SAS software order. Download a new SAS software depot, and then update from there. SAS Enterprise Guide does have a standalone installer, so updating the client machine can be simple once you have the install depot.
Thanks Chris, this is excellent news. Your mention of /LDEBUG sent me googling, and quickly arrived at a nice description of this undocumented option in a paper by Dave Riba at SUGI 25 (my first SUGI : ) http://www2.sas.com/proceedings/sugi25/25/btu/25p052.pdf Terrific to see the debugger added to EG. Can't wait to try it. I've seen Paul Dorfman use the data step debugger live during presentations, to show the flow of a datastep and the PDV content while hashing or doing DOW loops. Good stuff.
'Ye olde'… I've been programming so long it still seems like a 'new' feature!
great to see the "/ldebug" option
However,
...."this debugger still lives on in Base SAS!"
Wish it did! Then it would be available in SAS/Studio and University Ed!
???any time soon???
The team is working on it -- not sure when it will be introduced or what the UI will be like. But you can try it yourself right now. Enable "Interactive Mode" in SAS Studio, then run a DATA step with the /ldebug option. You can then issue DEBUGGER commands step-by-step and see the output in the log. It's not beautiful, but it's a proof-of-concept.
Fascinating. And exciting.
I'm getting a lot of "line out of range" when I set a break point -- even if I'm on that line. I can step through the code line by line but I can't seem to set break points. Odd. I'll have to dig into it a bit.
But super exciting.
--Jim
Jim, if you continue to have problems, grab some screenshots and a sample program (if possible) to send to SAS Support Communities or tech support.
Hi, Chris,
Thank you.
Any time I try to set a break point, even on the line currently being executed in the debugger, I get the message: "line number N out of range for compiled source".
I also can't get it to work with any program with an INPUT statement.
I'll try posting something on the Communities forum.
Jim
Chris, I updated my version of Enterprise Guide JUST so that I could access the DATA step debugger. This was always an extremely useful tool for me when writing code in Display Manager; I'm delighted to see it here in EG. Thanks, Chris, for writing about it in your blog, and thank you, developers!
Pingback: Ten SAS Enterprise Guide program editor tricks - The SAS Dummy
Pingback: Code debugging and program history in SAS Enterprise Guide - The SAS Dummy
Hi Chris:
As always, excellent!
Not about Debugger but: how useful is it to use Risk Finance Workbench (RFW) to run SAS programs in a production environment? What advantages would it have over SAS Enterprise Guide? Or would it be better batch execution?
Jaime, Risk Finance Workbench is designed specifically for the purpose of financial stress test/regulatory reporting for financial institutions. I'm sure there is plenty of SAS code at play behind the scenes, but it's not an environment for running ad-hoc SAS jobs. SAS Enterprise Guide is more of a generalist tool for any SAS program that you need to create, test, modify, and run interactively. For batch processing, customers often use OS-level tools or an enterprise scheduler like LSF.
Thanks for sharing. It can be super useful to know exactly how long something has taken to execute, especially when debugging slow loops.
It is important to remember though that the data step debugger works only at execution time. That means you can't use the data step debugger to help find compile-time errors such as missing semi-colons.
Hi Chris, thanks for your blog, which I referenced in a paper I published for WUSS on using SAS EG. I would love it if there was an EVALUATE command in SAS debugger to allow me to evaluate string functions and expressions I am trying to debug in code. For instance what is the result of 'NewVar'||STRIP(PUT,i,4.)) when i = 34? As it stands now, I have to end the debugger and go back to the old way of using PUT statements in code to test the output from my functions.
... and also if I could use more common keyboard shortcuts like up arrow to repeat my previous command, or ? to test an expression (the "evaluate" command I mentioned in my previous comment - I am more familiar with debugging in the VBA programming environment.)
Great suggestions! There might be some small improvements coming in SAS Enterprise Guide 8.1. And if you're familiar with Tools->Macro Variable Viewer, you can find an "evaluate" tool in there. But that's global, outside of the context of DATA step.
... if you are still taking suggestions, it would be great if I could edit my DATA step inside the debugger window, to make fixes, so I can rapidly retest, without having to end "Debug" mode, make changes, and then start "Debug" again. This would also alleviate the need to "Evaluate" expressions on the command line. This debugger tool is powerful. I am just starting to fully utilize it.