The ODS ExcelXP tagset has served us well over the years. It provides a reliable method to get formatted SAS output into Microsoft Excel workbooks, where the business world seems to like to live. And it's available in Base SAS, which means that you don't need SAS/ACCESS to PC Files and any extra setup to begin using it.
In SAS 9.4 Maintenance 1, ODS EXCEL was introduced as an experimental feature. Even though it still has the "experimental" label in the recently released SAS 9.4M2, I've found it to be a useful addition to the many ways I can create Excel content from SAS. ODS EXCEL offers a couple of big advantages over ExcelXP:
ODS EXCEL produces a native XLSX file. Users of the ExcelXP tagset know that Excel complains about the file format as you open it. And the XML Spreadsheet format that it uses is uncompressed, resulting in potentially very large files.
ODS EXCEL supports SAS graphics in the output. ExcelXP users have come up with creative methods to insert graphs "after the fact", but it's not as convenient as a "once and done" SAS program. With ODS EXCEL, graphics from SAS procedures are automatically included in output.
Syntax-wise, ODS EXCEL is similar to ODS TAGSETS.ExcelXP. Chevell Parker shares many of those details in his SAS Global Forum 2014 paper; in absence of official doc for this experimental feature, Chevell's paper is essential.
Let's dive into an example. The following program looks similar to how you might use the ExcelXP tagset, but can you see the key differences?
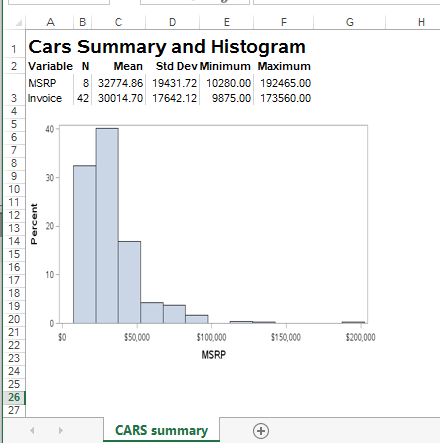
ods excel file="c:\projects\output\example.xlsx" /* will apply an appearance style */ style=pearl options( /* for multiple procs/sheet */ sheet_interval="none" /* name the sheet tab */ sheet_name="CARS summary" ); /* add some formatted text */ ods escapechar='~'; ods text="~S={font_size=14pt font_weight=bold}~Cars Summary and Histogram"; /* tabular output */ proc means data=sashelp.cars; var msrp invoice; run; /* and a graph */ ods graphics / height=400 width=800 noborder; proc sgplot data=sashelp.cars; histogram msrp; run; ods excel close; |
Note how I've targeted an XLSX file directly, instead of going through an XML intermediary file to placate Excel with the file format. And I included a graph with no problem. Like other ODS output destinations, I can apply styles and special formatting as needed. Here's a screen shot of the resulting spreadsheet:
I have a few additional observations from playing with this feature (did I say it was experimental?):
- ODS EXCEL doesn't perform well with large detailed output. That is, if I use ODS EXCEL and PROC PRINT a data set with lots of columns and many thousands of rows, it's going to be slow -- and might hit a wall with memory usage. For that use case, PROC EXPORT DBMS=XLSX works better (though that requires SAS/ACCESS to PC FILES).
- ODS EXCEL overwrites any existing Excel file that you target. That means that you aren't going to use this method to poke new values into an existing spreadsheet, or add sheets to an existing workbook. Compare that to PROC EXPORT DBMS=XLSX, which allows you to update an existing workbook by targeting just one sheet.

73 Comments
I'm looking forward to installing SAS 9.4M2, and working with the latest experimental version of ODS EXCEL. I always felt that, of the four ODS tagsets (ExcelXP, MSOffice2K, MSOffice2K_x, and TableEditor) to create reports that you could open in Excel, the ExcelXP tagset was over-promoted.
Last year, I compared the tagsets (omitting MSOffice2K, which, like ExcelXP, cannot imbed graphs) with the alternatives of simply using ODS HTML (and an xls file extension for the output) or DDE (Dynamic Data Exchange). When not using DDE, I had been frustrated to find that one or another feature I needed would be missing from the particular ODS tagset I was using at the time. If tagset A, then feature X was missing, if tagset B, then feature Y was missing, etc.
The criteria I used were whether or not each of the five alternatives supports:
Pivot Tables
Autofit Columns
Filters
Freeze Panes
Side-By-Size Elements (Tables and/or Graphs)
Multi-Sheet Workbooks
Graphs
Titles
(By “Titles” I mean title lines in a worksheet, which was impossible only for TableEditor.)
For ExcelXP, the answer is No for four criteria, which is exceeded only by HTML.
I was pleased to learn from Chevell Parker’s SAS Global Forum paper that the ODS Excel destination performs an automatic mapping of SAS formats to Excel formats. For all of the ODS tagsets, to get your data to be formatted in the style of your desired SAS format, it is necessary to go through extra rigmarole.
If the production version of ODS EXCEL delivers on all of the criteria listed above, it will be a tremendous improvement on the current situation of multiple partial-solution tools.
Until then, the only tool evaluated that delivers on all of the criteria is DDE. (To do create a Pivot Table with DDE requires you to first record an Excel macro. To create a Pivot Table with any ODS alternative requires use of the TableEditor tagset, which is best covered by Peter Fernwood in http://support.sas.com/resources/papers/proceedings14/1483-2014.pdf )
I also uncovered some idiosyncratic limitations/behaviors for the tagsets. If really interested in learning more about these I hope soon-to-be-obsolete alternatives, you can request my slide presentation.
Excel is a tool that any IT user has and knows how to use. Being able to deliver a full-function Excel workbook with SAS is a high-value capability. Your SAS deliverable can then be viewed, reformatted however the recipient prefers, and, if desired, used as a starting point for further exploration with a familiar tool.
LeRoy, thanks for the comments.
Because there are so many different ways to put data into Excel and pull data out, these "survey of methods" papers and posts are very useful. I don't expect ODS EXCEL to meet all of the criteria you laid out for total control of the spreadsheet creation and scripting -- it will be more like ExcelXP with the added advantages I highlighted. For complete control of SAS content in an Excel ecosystem, I always recommend the SAS Add-In for Microsoft Office. That tool allows you to work in Excel using scripting, native charts, pivot tables and the like -- all while pulling your best SAS content in exactly how you need it. I realize that the SAS Add-In isn't part of every SAS programmer's toolbox, but as part of SAS Office Analytics, it's growing much more prevalent.
New capabilities are available to generate graphs in Excel from SAS 9.4 TS1M3 not as a simple object but as a graph that can be further on fine tuned in e.g. Excel 2013 with ods excel and the new proc mschart.
http://support.sas.com/documentation/cdl/en/odsproc/67922/HTML/default/viewer.htm#n1h9n5x80juyc3n1w9uka1ons2u5.htm
Chris,
As i have mentioned in the Linked In Comments section to this Post and as suggested by One more SAS User, it would really be very very Useful if ODS EXCEL can be used to update an Exisitng Excel Tempate especially when the Excel template resides on the Unix Environment..Hopefully Chevell Parker will make a Note of this.
Prashant,
Believe me, I'm sure Chevell (as a SAS Tech Support guy) hears it all from SAS users who are looking to do fancy things with SAS and Excel. Of course, it's a great idea to share your feedback with Tech Support or via the SASWare Ballot.
Hi Chirs,
I ran the proc means / histogram example in your blog post of August 29, 2014. When I opened the excel spreadsheet made by the example, excel did not complain which is great.
However, I did find a problem with the excel spreadsheet. In excel I tried to be format the proc means output, but I could not do it. The problem is the individual stats for the msrp and invoice variables are written to the same cell. For example, there is only one cell for n stat from the two variables. Since there is only one cell, 8 and 42 that are written to cell.
I ran all three of the ODS excel destination examples in Chevell Parker's paper SAS 177-2014. There was no doubling up of data in the cells in excel spreadsheets that I created. I am happy to report that the last example does have output from a proc reg and an ods graphic and there was no problem.
What is the source of this selected doubling of data in excel spreadsheet cells?
Thanks much
Doug DeGrote
Doug, I haven't yet looked into it -- but it could be just a matter of how the ODS output is organized, with a side effect that these two formatted values share a cell. ODS "report" destinations are organized to look good in the destination, and aren't necessarily organized to be used as data. For a pure data output, you could use ODS Select and OUTPUT statements (or simply PROC MEANS with an OUTPUT statement) and then PROC PRINT that data set to an ODS EXCEL destination.
Hi Chris,
I did successfully transfer the data to excel when I used a PROC MEANS with an OUTPUT statement and used a PROC PRINT that data set to an ODS EXCEL destination. Below is the code I used:
proc means data=sashelp.cars; var msrp invoice; output out=proc_means_output_1; run; proc transpose data=proc_means_output_1 out=flipped; id _stat_; /* variable names in flipped data set */ var MSRP Invoice; /* put data column in incoming data set to data in rows in flipped data set */ run; data flipped_2 ( Rename= (_NAME_=Variable)); set flipped; /* n variable fix: get rid of annoying dollar format */ format n 4.0; run; title1 "Proc Print based on Proc Means Output data set"; proc print data=flipped_2 noobs; run;Hi Chirs,
I also followed your suggestion that I use ODS Select and OUTPUT statements.
I interpreted your suggestion by adding the two lines of ODS code to the proc means within the ODS excel file=... and ODS excel close grouping of code. Below is my code with the extra two lines of ODS code.
The results of the Ods select Summary statement was the same as before, information for both variables were placed in the same cell.
I used a proc print to list the contents of Proc_means_output_2 file. The result of the ODS output / Proc Print coding produced a table with one observation instead of two observations of data. The one observation table has all the data but the table has the data in a format is not ready for prime time.
Thanks much,
Doug DeGrote
Pingback: Using ODS EXCEL and PROC EXPORT to bundle Excel-based reports - The SAS Dummy
The advantage of Excel controls in Base SAS vs Add-In for MS Office is that Excel reports can be generated offline in batch mode and delivered to business staff who do not have Add-In for MS Office installed.
Rod, yes -- PROC EXPORT and ODS EXCEL and other SAS code approaches are perfect for batch operations. However, you can script/automate SAS Add-In operations too! See this terrific paper by Tim Beese that shows you how. While you need to have the SAS Add-In in order to run the script, the consumers of the Excel content do not need the SAS Add-In for Microsoft Office in order to view/work with the result.
Pingback: Don’t panic: maybe your XLSX file is already opened - The SAS Dummy
Hi Chris
I have been experimenting a little as to find an DDE alternative using the START_AT option. However this doesn’t work for me:
Expected: A1: We are at A1
          B2: We are at B2
Observed: B2: We are at A1
          B3: We are at B2
Is it supposed to work this way? I would be ever so happy if SAS Institute would give it a thought.
Regards, Peter
Peter, thanks for the comment. Currently, the START_AT option does not allow you to modify the "output position" in mid-sheet. I expect that what you are observing is ODS EXCEL respecting only the last START_AT option that you specify.
I have seen this request come in just recently -- perhaps from YOU if you have already been talking to SAS about it. Current thinking is that this is very difficult to accommodate when rendering the XLSX format due to the internal structure of the file. DDE works because it's not worried about file format: it's sending direct commands to the Excel application to move the cursor around.
Hi Chris
Thanks for answering so promptly ;-) Yes - the last START_AT wins. And yes, DDE works nicely if you have Excel on the SAS-server (or pc with SAS installed on it). In Statistics Denmark we currently use (via RDP) EG and Classic SAS installed on Windows servers. This in fact works pretty well (and eliminates the local workstation installs). But we don’t want to clutter up the SAS servers with Excel. So for now the DDE users have to look for alternative solutions. For a short moment I thought I had won the lottery ;-)
An idea: How about a PROC EXCELWRITER that reads a SAS dataset with two columns POS and VALUE (maybe also CELLFORMAT).PROC EXCELWRITER then updates the internal XML-files of an XLSX file (in reality a ZIP file that SAS can read). No Excel to be involved here.
proc excelwriter data=excelupdates file="h:\MyExcelFile.xlsx";cellposvar=pos;cellvaluevar=value;cellformatvar=cellformat;run;I know it’s not as easy as it looks at first glance due to the internal XML file relationships. Oh yes and the risk of future changes the internal structure of the XLSX file.Regards,
Peter
Hi Chris,
Could you please show an example of how to add a picture in excel using ods excel.
Thank you
Hi Chris,
I wanted to output two data sets generated using proc report on the same page . Table 1 first and followed by table2 below it . How do I achieve this using ODS TagSets excel xp. I'm able to output each table in different tabs in the excel spreadsheet but not one below the other on the same tab.
I want to output two different reports created using proc report and output them into excel using one below the other using ODS TAG SETS excel xp.
I think you want to use the SHEET_INTERVAL=None option (instead of =Proc or =Table). There is a handy quick reference for the ExcelXP tagset here.
Hi Chris,
I created excel spreadsheet with 3 proc reports on one tab using sheet_interval= 'none', next step is to create exact same output for 36 different cities. In order to achieve this I created macro
with Proc report which gets exported to excel using ODSTagsets. I have to repeat this process 36 different times and all the output need to be in the same excel spreadsheet, but in different tabs. When I run the macro within ODS facility it overwrites the same excel spreadsheet. Is there a way to achieve this.
Thanks a bunch!
Use the sheet_name option to start a new worksheet (aka tab) in the current work book
ODS EXCEL options (sheet_name="&city_name");
I figured it out creating a macro within a macro creates outputs multiple tables with sheet_interval= 'none' and creating a macro within ODS facility outputs multiple tables in different tabs in excel spreadsheet multiple tabs in excel spreadsheet.
Thanks!
I'd like to get my hands on the macro code that does this, Simi.
Pingback: Using Lua within your SAS programs - The SAS Dummy
Hi.
i have a problem With ods Excel.
i get this error Message:
ERROR: Unable to load module 'SpreadsheetML' from template store!
ERROR: No body file. EXCEL output will not be created.
What is this? i've googled and searched for it, but no luck so far.
I am currently using ods tagset.excelxp With proc report to create the spreadsheets.
I really don't want to have xml files, i want the output to be normal Excel files.
Hi Bjorn, Are you sure you're using ODS EXCEL statements -- with SAS 9.4 Maint 2 or Maint 3? If so, you might need to contact Technical Support about this.
Hi all, is there anyway that we can use excelxp to output results into multiple workbooks,and each work book containing multiple sheets in them?
Yes, you could do that. ODS TAGSETS.EXCELXP allows you to segment your output into different sheets. Here is a SAS Global Forum 2012 paper written by another user -- it explains how with many examples.
For each workbook (separate Excel file), you would need to use a different ODS TAGSETS.EXCELXP destination.
I'm sorry, I forgot to mention I am using SAS EG 5.1.
This is my basic code for ODS Excel:
ods excel file="H:\terminkjoring\F&f_nr._&ar_input.&termin_input..xls"
  style=statistical
  options (suppress_bylines='yes');

ods excel options(sheet_interval='none' sheet_name="&fylkenavn2.");

proc report creates output here:
run;

ods _ALL_ CLOSE;
From what i have found ODS and proc report is the most suitable for formatting output the way i want. proc export works, but it just creates tables without any formatting.
Is there another way to create Excel files that allows me to format the output like ods and proc report?
Bjorn,
That code should work, but it would require SAS 9.4 Maint 2 or 3. If you're using SAS Enterprise Guide 5.1, you might be still on SAS 9.3. (SAS Enterprise Guide 5.1 would work with 9.4, but I would expect you to be moved to 6.1 or 7.1 if you had SAS 9.4.)
Otherwise, you would have to use ODS TAGSETS.EXCELXP -- the syntax is similar but the output is an Office XML file, and not a native XLSX file.
yes, we are still using 9.3.
Guess i am stuck with tagset.excelxp for now then.
i was thinking of importing the xml file and using proc export to get it to native Excel, but i Guess the formating will be gone?
Yes, that's right -- Once you export as data, then the spreadsheet arrangement (display formatting from ODS) is gone.
Hi ,
I have downloaded the tableeditor and am trying to run the code for pivot table but its throwing me errors like 1) ERROR: Insufficient authorization to access /sas/config/Lev1/SASApp/C:\Users\pmuppidi\MySAS\Sample1.xml.
ERROR: No body file. TAGSETS.EXCELXP output will not be created.
2)ERROR 13-12: Unrecognized SAS option name NOXSYNC.
Please some one assist me in getting this fixed . Code is below :
ods tagsets.ExcelXP file="C:\Users\pmuppidi\MySAS\Sample1.xml" options(sheet_name="Sheet1");
proc print data=Sample1;
run;
ods tagsets.Excelxp close;
/* Create and execute the script file that is generated */
/* with the TableEditor tagset. */
ods noresults;
options noxwait noxsync;
ods tagsets.tableeditor file="C:\Users\pmuppidi\Downloads\tableeditor\tableeditor.tpl"
options(update_target="C:\\Users\\pmuppidi\\My SAS\\Sample1.xml" open_excel="no" output_type="script"
sheet_name="Sheet1" pivotdata="quantity,quantity,profit,profit"
pivotdata_stats="sum,sum,sum,sum" pivotcalc="none,total,none,total"
pivotpage="Mail type,Mail id " pivotrow="New,Repeat"
/*pivotdata_caption="Sum of Quan,% of,Sum of Prof,% of"
pivotdata_tocolumns="yes");*/
data _null_;
file print;
put "Sample1";
run;
ods tagsets.tableeditor close;
x "cscript 'C:\Users\pmuppidi\Downloads\tableeditor\tableeditor.tpl'";
From the paths in the log, it looks like you're running on a UNIX (or Linux) version of SAS, but your code references files on your local Windows machine. If using SAS Enterprise Guide with a remote SAS session, you'll need to change those paths to a folder you can write to on UNIX (ex: /u/pmuppidi). If using SAS University Edition, you'll have to reference the shared folder between the SAS session and your Windows machine.
Thanks Chris . Yes i did change the path and its better now . But when i run the code , its not showing errors but am only getting result output in text format and i did check in the results viewer where its checked under SAS REPORT , HTML and TEXT . Please provide your input .
Prashanth, EG isn't wired to automatically download other types of results. You'll need to use another method to download the XLSX file that you created. Here's a technique that might help; it uses the Copy Files custom task.
Hi,
I am using the below code to generate the pivot on UNIX via JavaScript. However the option noxsync noxwait; both are invalid option and I am not able to see the final pivot an chart output. I am using SAS9.4 version on UNIX. Kindly let me know if I am missing anything. Thanks for the help!
options noxsync noxwait;
ods tagsets.tableeditor file="/apc/analyst/abdfc/temp/PivotChart.js"
/* remember to escape the backslashes */
options(update_target="/apc/analyst/abdfc/temp/temp.xlsx"
output_type="script"
sheet_name="shoe_report"
pivot_sheet_name="Profit Analysis Pivot"
pivotrow="region"
pivotcol="product"
pivotdata="sales"
pivotdata_fmt="$#,###"
pivot_title="Pivot Analysis for XXX"
pivot_format="light1"
pivotcharts="yes"
pivot_chart_name="Profit Analysis Charts"
chart_type="columnclustered"
);
/* dummy output to trigger the file creation */
data _null_;
file print;
put "test";
run;
ods tagsets.tableeditor close;
X '/apc/analyst/abdfc/temp/PivotChart.js';
Hi, this approach won't work on a UNIX machine, where the script is used as a post-process step. The script automates Microsoft Excel, which has to be running on a local Windows machine. You can use Linux SAS to generate the initial XLSX file and the script, but the two need to end up on a Windows machine where you then run the script.
Hi,
I am using ODS EXCEL / ODS tagsets.excelxp to generate .xlsx output using SAS.
I need to present Column Grouping in the Final Excel output.
In Excel, I would do it as -
1. Select desired columns (side by side)
2. Goto Menu -> Data -> Group -> Group
This gives me a horizontal line above these columns with a "-" sign. Using this sign, I can hide / unhide these grouped columns.
Now, I want to have same output using SAS.
Can anybody suggest how to do it? I am using SAS Studio currently.
Thanks in advance for your help.
Thanks,
Ajay.
I'm not sure that this can be done (the Group with +/-) unless you have a script to post-process the Excel file.
But you can achieve the "across" grouping layout with PROC REPORT. Cynthia's paper has a pretty thorough description of how to accomplish this.
I'm having some issues with this. I'd like to direct some output to one tab, then move to another tab.
On my PC, running 9.4 Service Pack 1 this code produces exactly what I expect, two tabs, one with the rows of females and the other with the rows of males.
ods excel file="&path./excel.xlsx";
ods excel options(sheet_interval='none' sheet_name="Females");
proc print data=sashelp.class;
where sex="F";
run;
ods excel options(sheet_interval='none' sheet_name="Males");
proc print data=sashelp.class;
where sex="M";
run;
ods excel close;
ods tagsets.excelxp file="&path./tags.xls";
ods tagsets.excelxp options(sheet_interval='none' sheet_name="Females");
proc print data=sashelp.class;
where sex="F";
run;
ods tagsets.excelxp options(sheet_interval='none' sheet_name="Males");
proc print data=sashelp.class;
where sex="M";
run;
ods _all_ close;
But when I run the same thing on our UNIX box running SAS 9.4 with the latest Service Pack, I end up with just what I expect from tags.xls, but on excel.xlsx I get one tab called Females and both tables are printed there.
And of course it isn't this simple. I need the ODS Excel destination because I'm really doing graphs and I need the latest service pack because the graphs I'm doing aren't supported in SP1.
Ok, got an answer from SAS tech support. It is an issue with SP3 that will hopefully be fixed with SP4. You can put everything on one tab, or one thing per tab, but if you want a couple things on one tab, and a couple things on the next tab, you have to trick SAS into creating the new tab.
ods excel file="C:\elever.xlsx";
ods excel options(sheet_name="SkoleElever" sheet_interval="none");
proc print data=sashelp.class;
run;
proc print data=sashelp.class;
run;
/* Add dummy table */
ods excel options(sheet_interval="table");
ods exclude all;
data _null_;
file print;
put _all_;
run;
ods select all;
ods excel options(sheet_interval="none");
proc tabulate data=sashelp.class;
class age sex;
table age, sex;
run;
proc print data=sashelp.class;
where age=12;
run;
ods EXCEL close;
Greetings,
I am using ODS EXCEL to generate .xlsx output using SAS EG, transitioning from PC SAS to a .rtf file. Can you advise how best to add a .jpg to a footer to the .xlsx output? My old code is '^S={PREIMAGE="Location\Picture.JPG"}';. Thank you, Robyn
Hello Chris,
Does ODS EXCEL have the possibility of creating a data validation list just like in Excel (drop down menu with hardcoded values to choose from )?
Thanks
No, not directly. You could set something up with post-processing -- running a VBA script to grab a range and assign a validation list.
Hi Chris,
Can u show a code using ods tagsets to generate an excel file with merged cells? mergeAcross wont work. Thank you in advance.
ex:
-from a sas table:
-----------------------------------------------------
|             1               |                     |
-----------------------------------------------------
|            2                |         3          |
-----------------------------------------------------
-to an excel file:
-----------------------------------------------------
|                             1                    |
-----------------------------------------------------
|            2                |         3          |
-----------------------------------------------------
(for a better illustration)
-from a sas table:
-----------
| 1 | |
-----------
| 2 | 3 |
-----------
-to an excel file:
----------- | 1 | ----------- | 2 | 3 | -----------Martin,
I suggest that you post this question to the ODS and Base Reporting forum on SAS Support Communities. Share some sample data, code you've tried, and your desired results. I'll bet that an expert will respond quickly with a technique you can use.
Hi Chris,
I run the code in your blog and I did got a xlsx file, but it's not perfect! I run on SAS 9.4 TS1M2. The two variables MSRP and invoice and their corresponding stats are in the same cells.
ODS EXCEL was declared "production" in 9.4 TS1M3, so this issue would be fixed there. You could try with the free SAS University Edition to see if your test case works.
Hi,
I am trying to convince the tech-people here that some new EG 7.1 features are not yet working.
Especially ODS excel. You mention "9.4 TS1M3", is that the same as our &SYSVLONG=
9.04.01M3P062415 ?
That's the correct version of SAS. Now, you have to check your version of SAS Enterprise Guide. v7.1, 7.11, and 7.12 are all part of the "7.1" family, but some new features are present only in 7.11 or 7.12.
i used ods tagsets.excelxp before to make Excel-files, and used proc report to print to this Excel file. the first line in this Excel file was made by #BYVAL and it worked With Excelxp.
now i changed my code to use ods Excel because i wanted native Excel files. but now the proc report won't resolve #BYVAL like it did before.
this is the code that creates the Excel-file, the options are similar for Excelxp and Excel for this part :
ods Excel/tagsets.excelxp file="...\F&f_nr._&ar_input.&termin_input..xls"
style=statistical
options (suppress_bylines='yes');
this is the code before With ods tagset.excelxp:
ods tagsets.ExcelXP options(sheet_interval='byfullknavn' sheet_name='#BYVAL(fullknavn)');
proc report data=kommuner_&f_nr. headline headskip nowindows noalias;
column ("#BYVAL(fullknavn)" "&ar_input." '--' );
by fullknavn;
this is the code With ods Excel:
ods excel options(sheet_interval='bygroup' sheet_name='#BYVAL(fullknavn)');
proc report data=kommuner_&f_nr. headline headskip nowindows noalias;
column ("#BYVAL(fullknavn)" "&ar_input." '--');
by fullknavn;
any ideas why ods Excel won't resolve that #BYVAL for the column and ods tagset.excelxp does?
only difference is the ods option sheet_interval.
Bjorn,
This is a great question to post to the SAS Support Communities, where experts from the community and SAS can help you (and others with the same question).
I suggest you start with this ODS board and see what the experts say.
Hi Chris,
I have created some bar charts by using gchart in SAS EG7.1. Now I want to export these vertical bar charts to excel. Also I need to put two graphs (Bar charts) side by side. Could you please provide me a sample code to do this. Waiting for the reply. Thanks in advance
You might be interested in this great demo from Chevell Parker (8-minute video). Also check his comprehensive paper on ODS EXCEL.
Thanks a lot. Now I have exported bar charts in excel but I don't want the table and description of graph that is displaying along with the charts. Also could I change the format in saved excel & if I run again the same code, does that format of the chart remains as I changed or should I do this in code only?
Unless you're using the SAS Add-In for Microsoft Office (which runs the SAS code for you and pulls the results into Excel), your formatting changes will not be retained when you re-run code. If you are using the SAS Add-In -- then yes! It works.
If you want to remove the graph title from the image (if it's embedded), make sure that the NOGTITLE and NOGFOOTNOTE options are specified on your ODS statement.
Pingback: Send your SAS graphs to Excel, directly to Excel ... - SAS Learning Post
Hi Chris,
I am using SAS EG 4.1 and report graph format is "Active X". I am trying to export my graph to excel using ODS Excel. But the GRAPH doesn't get exported to excel and the page is empty.
If change the graph format to "JPEG" its working but the graph is not looks good.
It could be great help if you advise me on this.
Senthil
EG 4.1? So you're using SAS 9.1? JPEG graphs look much better in later versions of SAS. You might try using the ActiveX Image or Java Image format instead, which produces a graph that looks like ActiveX but isn't interactive.
Hi Chris,
Thanks for your response.
I have created charts using SAS EG 7.1. The below code I was using to create graphs. The Graph is not copied to excel if I set graph format to "ActiveX/Java" and graph is not clear as expected if I change to "JPEG" graph format.
Appreciate if you suggest any other alternate for this. Thanks.
libname mylib 'M:\SG\MV\retail\data\sandbox';
ods excel file="M:\SG\MV\Test2.xlsx"
;
data anno1;
length function style color $8 text $20;
retain xsys '5' ysys '5' when 'a' color 'white';
function='move';x=48;y=2.2;line =1;output;
function='draw';x=50;y=2.2;line=1;output;
function='label';color ='black';x=43.3;y=2.2;position='6';size=.9;text="KS";output;
function='move';x=55.5;y=2.2;line =37;output;
function='draw';x=57;y=2.2;line=37;output;
function='move';color='black';x=38.7;y=1;size=.9;line =1;output;
function='symbol';color='white';x=64.5;y=0;position='6';size=3;text="cube";line =0;output;
function='label';color ='black';x=55;y=2.2;position='6';size=.9;text="Accuracy Ratio";output;
run;
goptions cback= white;
symbol1 i=hilot v=none c=black h=0 W=0;
symbol2 i=none v=cube c=red h=0 w=0 pointlabel=none ;
symbol3 i=JOIN h=9pt v=DOT CV=blue CO=blue LINE=1 w=1 CI=blue pointlabel=none;
symbol4 i=JOIN h=5pt v=NONE CV=black CO=black LINE=37 w=2 CI=black pointlabel=none;
Legend1
LABEL=( FONT='Arial' HEIGHT=8pt JUSTIFY=center " ")
VALUE=(FONT='Arial' HEIGHT=8pt "Threshold" " " " " " " );
;
PROC GPLOT DATA=mylib.test ;
PLOT
BOUND1*calc_poolv
AR*calc_poolv
KS * calc_poolv
tresh*calc_poolv
/ overlay haxis=axis2 vaxis=axis1 LEGEND=LEGEND1 anno=anno1;
;
;RUN;
ods excel close;
You could try ActXImg or JavaImg to create a graph that looks like the ActiveX result, but won't be interactive. Also, you might try using PROC SGPLOT instead; I think you can achieve the same graphical result with less code.
Pingback: Using SAS to add PivotTables to your Excel workbook - SAS Users
Pingback: Using LIBNAME XLSX to read and write Excel files - The SAS Dummy
Hi Chris,
I'm just getting into ODS Excel (versus excelXP tagsets) and I'm finding that in my company's implementation of SAS 9.4/SAS EG 7.12 HF1 (7.100.2.3362) (64-bit), I get the following error while trying to submit your example code:
ERROR: ZIP entry duplicate name: _rels/.rels.
Do you know what might be causing this?
Thanks!
Gerry
From what I've read, this can happen if you have multiple ODS EXCEL destinations active that aren't discerned by using the ID= (Ex: ODS EXCEL(id=excel1)...)
What specific version of SAS 9.4 do you have (maint level)? Some of this might have been addressed in Maint 3 or Maint 4.
It looks like we're still on Maint 1, so I'll pass that info along to our IT department and hopefully they can get that updated. In the meantime, adding an ID to the ODS statement got rid of the error perfectly. Thanks for your help!
We will FINALLY be going to 9.4 in the next few weeks! Horray!! In the meantime I am curious to know if graphs produced by ODS Excel would be editable by excel users. Are they indistinguishable from native Excel charts?
Could you email me the output of that code? Thank you.
Jeff,
The graphs created by SGPLOT are not native Excel charts, they are static images (usually PNGs) created by SAS. However...if you have the SAS Add-In for Microsoft Office, you can create native charts using the graph tasks in the SAS menu -- reporting on SAS data. There was, for a short time, an experimental PROC MSCHART that could create native charts in Excel, but that is not available in the most recent releases.
Hi Chris
Any idea when performance for ODS Excel will improve? I just ran some tests and to dump a table with 5000 observations and 40 columns it takes about 70 seconds on my machine. That's a LONG time for a mere 5k observations.
Are you familiar with what may be slowing it down? I was wondering if there are any tips or tricks you could think of that may speed it up? I was considering simplifying the style it uses by creating an almost empty .css file and trying to use that... Also considering removing all SAS formats from the dataset to see if that may make a difference...
If I can't find a way to speed this up I'm afraid it's back to csv output for me which would be a shame as I love the features the ODS excel destination offers.
Thanks
I don't know. That does seem like a long time in your test -- I haven't seen it that slow. Are your fields very large? (Record length?)
For fast performance of just data export, PROC EXPORT with DBMS=XLSX is very fast. If you want styles/layout, then you need ODS EXCEL.
So my original dataset had a record length of 2735... I shaved it down to 1505 and that took it from 70 seconds to 61.
I then tried removing all formats... that took off a few more seconds.
Finally I tried creating an empty style using proc template. That took off about another 6 seconds.
So I was able to get it from 70 seconds to 54... but that's still incredibly slow for a small table dump.
Looks like proc export it is... fortunately I have SAS/ACCESS Interface to PC Files.