I've been working with date-time data on a recent project, and I've come across a few SAS programs that have "opportunity for improvement" when it comes time to create reports.
(Or maybe I haven't, and I contrived this entire blog post so that I could reference one of my favorite quotes from the movie Animal House.)
Suppose we have a data set that contains a collection of measurements over a one-year period, each with a time stamp that shows when the measure was captured. Here is a DATA step program that creates a sample data set, generating just over 300,000 rows of random measurements (with a bit of variation built in for visual interest later):
/* Create a year's worth of timestamp data */ data measurements (keep=timestamp measure); now = datetime(); /* go back one year - minus number of seconds in a year */ /* remember, SAS datetime value is number of seconds */ /* since 01JAN1960 */ yearago = now-31556926; length timestamp 8; format timestamp datetime20.; do val = yearago to now; if (ranuni(0) < 0.01) then do; /* add a few more records on certain days of week */ if (weekday(datepart(val)) in (1,2) and ranuni(0)<.5) then do; timestamp = val; measure = 5 + log(ranuni(0)); output; end; timestamp = val; measure = 5 - log(ranuni(0)); output; end; end; run; |
The "classic" method for reporting on this data is to use a line plot to show the time series, as shown by this program and plot:
ods graphics / width=800 height=300; proc sgplot data=measurements; series x=timestamp y=measure ; xaxis minor label="Time of measure"; yaxis min=-8 max=20 label="Measurement"; run; |
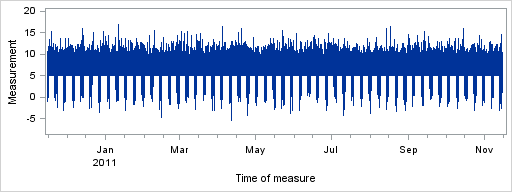
But sometimes we want to report further on the characteristics of the data, to answer questions such as "how many measurements were captured for each month? for each quarter? or for each day of the week?"
Creating categories the hard way
Sometimes while creating these reports, programmers decide to prepare the data further by creating new categorical variables (such as a variable for the day of the week, or for the month and year). For example, I've seen snippets such as this:
/* numeric day of week */ day = weekday(datepart(timestamp)); /* value such as "2011_3" for March 2011 */ year_month = cats(year(datepart(timestamp)),'_',month(datepart(timestamp))); |
But there are problems with this approach, especially with the "year_month" example. First, it requires another pass through the data and additional storage space for the output. And in the "year_month" case, the result is a character variable, which no longer retains the ability for sorting the output in chronological order. (Yes, with a more clever construction we could make sure that there is a leading zero for single-digit months, and that would help...but there is an easier way.)
Use SAS formats instead of creating new variables
The person who wrote the above code forgot about the power of SAS formats. Using SAS formats, you can "recast" your variable for analysis to create a category from values that are otherwise continuous. You don't have to modify the original data at all, and it doesn't require you to make an additional copy.
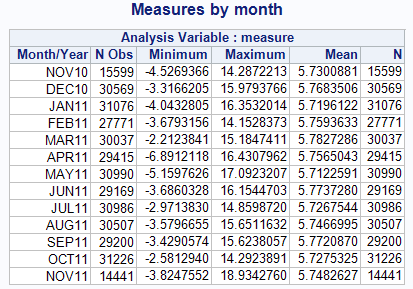
For example, to create summary statistics for the measurements classified into month "buckets", you can apply the DTMONYY5. format within a PROC MEANS step. The DTMONYYw. format takes a date-time value and converts it to a month-year appearance. SAS procedures such as MEANS, FREQ, SGPLOT, and most others will use the formatted value for classification. You can see how this program produces a report of statistics classified by month-year:
title "Measures by month"; proc means data=measurements min max mean n; /* tells the procedure to bucket values into monthly bins */ format timestamp dtmonyy5.; label timestamp = "Month/Year"; class timestamp; var measure; run; |
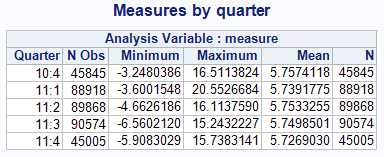
With a minor change to use DTYYQC4. instead, we can produce a report of stats by quarter:
title "Measures by quarter"; proc means data=measurements min max mean n; /* tells the procedure to bucket values into quarterly bins */ format timestamp dtyyqc4.; label timestamp = "Quarter"; class timestamp; var measure; run; |
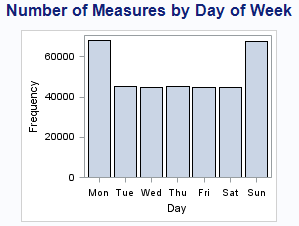
This isn't limited to tabular output. Applying a format can also help to simplify plots as well. Here is an example of an SGPLOT step that creates a frequency report of the number of measures for each day of the week, thanks to the DTWKDATX8. format:
title "Number of Measures by Day of Week"; ods graphics / width=400 height=300; proc sgplot data=measurements; /* tells the procedure to bucket values into day-of-week bins */ format timestamp dtwkdatx8.; label timestamp = "Day"; vbar timestamp; run; |
The next time that you find yourself creating a new variable to serve as a category, check whether there might be a SAS format that you can apply instead. Even if there isn't, it might still be more efficient to create a new format rather than calculate a new variable, especially if it's a category that you need to use for multiple data sources.

11 Comments
1) When I was learning SAS, I would sometimes confuse the date (a numeric variable) with it's formatted value (a character string). One place where this comes up is in computing statistics for date/time variables. For example, at first the following PROC MEANS output looks surprising:
I don't know how to get PROC MEANS to produce formatted output, do you? I always write to a data set and then use the format on PROC PRINT:
2) I included some references on SAS dates and times (SUGI papers, books,...) at the end of my data/time post from a few months ago. They are filled with lots of useful tidbits.
Good comments Rick. I don't have a good answer, but I do have more information to throw at you and perhaps keep you busy for a while.
You can also get data set output via ODS OUTPUT, with a statement like this:
You can control the layout of the ODS OUTPUT data a bit more in SAS 9.3 using the STACKODSOUTPUT option.
If you look at default data set layout when you using the OUTPUT statement in PROC MEANS, all measures are stacked in a single column. That may explain why the formats of the source variables are not inherited in the output data when it comes to printing them. I often use the technique you cite: save the output data and then PROC PRINT it.
You want formatted output from PROC MEANS?
then come to SAS Global Forum - Tuesday 24 April - presentation at 01:30 - 01:50 PM
paper 321-2012 .
According to "Solve the SAS® ODS Data Trap in PROC MEANS"
Totally agree with your comments on the use of date formats in reporting. In answer to Rick's question, I don't believe there is a way of returning the formatted value in Proc Means. You can, however, use Proc Tabulate to do the same calculations and show the formatted values.
proc tabulate data=measurements;
var timestamp;
table timestamp*f=datetime20.*(min median max);
run;
Thanks for the valuable information.
Looks like you left your comments the same when changing the size of the bins....
Yes, I sure did. Thanks for catching that! I fixed it.
Pingback: Just-in-time data prep in SAS Enterprise Guide - The SAS Dummy
I am not a blogger, but I have been using SAS for about six years. Let me know if there is a better forum for this question.
Can you help me optimize these variables?
I just recently took the Macro Language class and I am very familiar with SQL. I am converting others code and trying to optomize the macro variables used within the code.
We do our reporting of data based on the previous month on data with effective dating. If I use SQL, the dates are in one format, if data step, they must be in the datetime, if used as part of a file name, they are in yet another format. How best can I use today's date to create all the variables I need for my process without rewriting all the code?
The following code is used throughout the process. We are looking at last month as a report month and looking a one year's worth of data.
Great question Allison! I suggest you visit our communities.sas.com and post your question there. There is a forum dedicated to Base, Data Step and Macro language questions. The participants in the forum are sure to provide at least one, possibly several, useful answers.
How to convert dd-mm-yyyy example , 26-11-2015 into 26112015 or the binary date format ??
Thanks in advance and apologies for the naive question..
Srikanth,
Use the ANYDTDTEw. informat to interpret this date. The date's format is DAY-MONTH-YEAR, and you can force that interpretation with the DATESTYLE option. Example:
Output will be: 26NOV2015
Since date values can be sometimes ambiguous depending on the style (08-11-2015 can be August 11 in the USA, or November 8 in Europe), the DATESTYLE option is important. You can set the DATESTYLE option to LOCALE, which will use your system locale settings to drive the behavior. Use DATESTYLE=DMY when you want to ensure the DAY-MONTH-YEAR interpretation.