
In football, five out of the 11 players on offense are on the field to accomplish one goal: keep the defenders as far away from the ball as possible. Sometimes it’s more than five. Teams will bring extra linemen on short-play packages. Tight ends and full backs might check in for extra blocking. Running backs will help in pass protection. And even quarterbacks might throw a hit on a defender every now and then.
Blocking is an essential part of the game, so I wanted to explore if investing more in the offensive line correlates to winning. There are three ways a team can acquire an offensive lineman (or any player for that matter):
- Free agency
- Drafts
- Trades
Trades are hard to quantify because it’s very difficult to compare them apples to apples. Some trades are simple – one player for another. Others are more complicated and involve multiple players and draft picks. To keep things simple, I will only look at how teams invest in their offensive line through the draft and through their payrolls.
Investing in the offensive line through the draft:
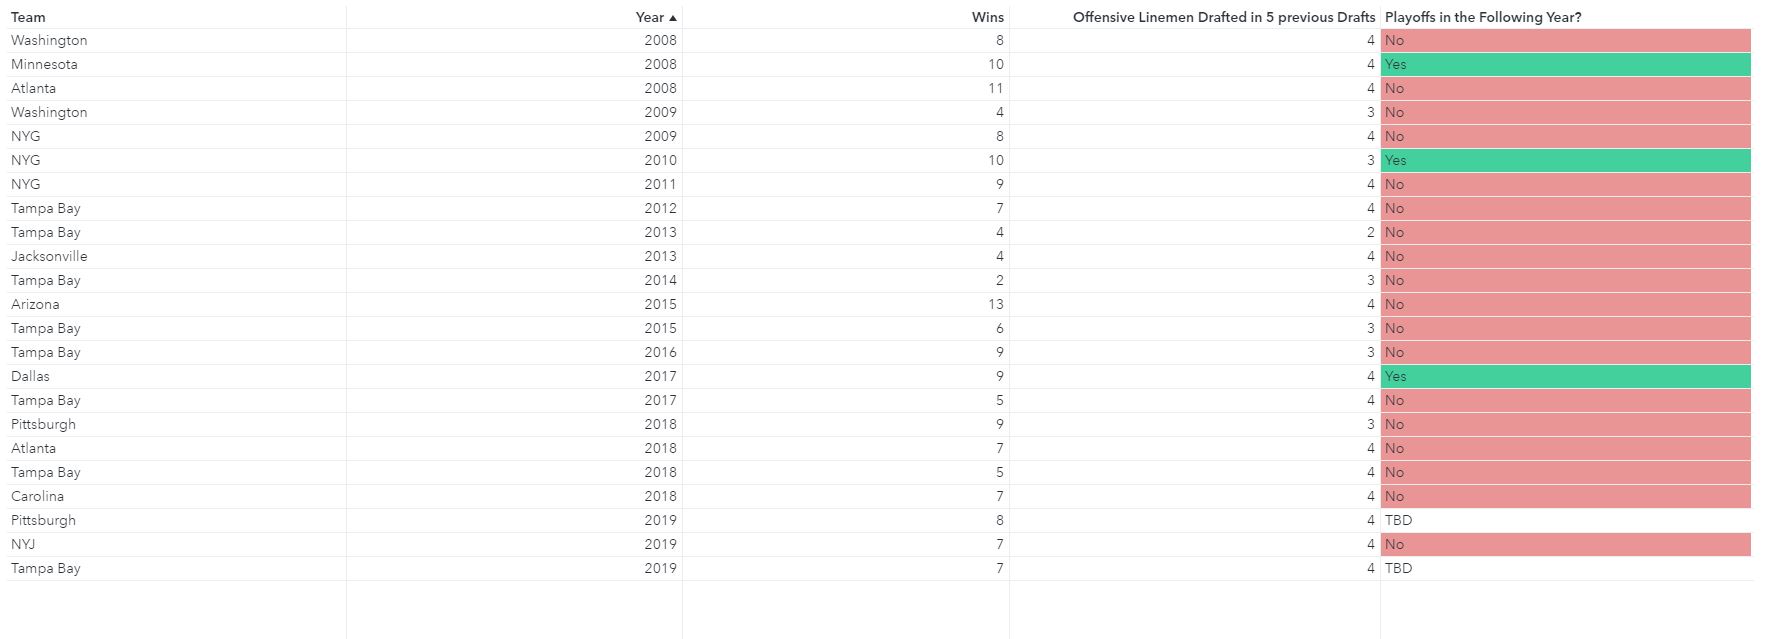
Looking at draft picks since 2005:
- 21 teams drafted four or fewer offensive linemen in a five-year span. Of those 21 teams, 18 did not make the playoffs the following season (86%).
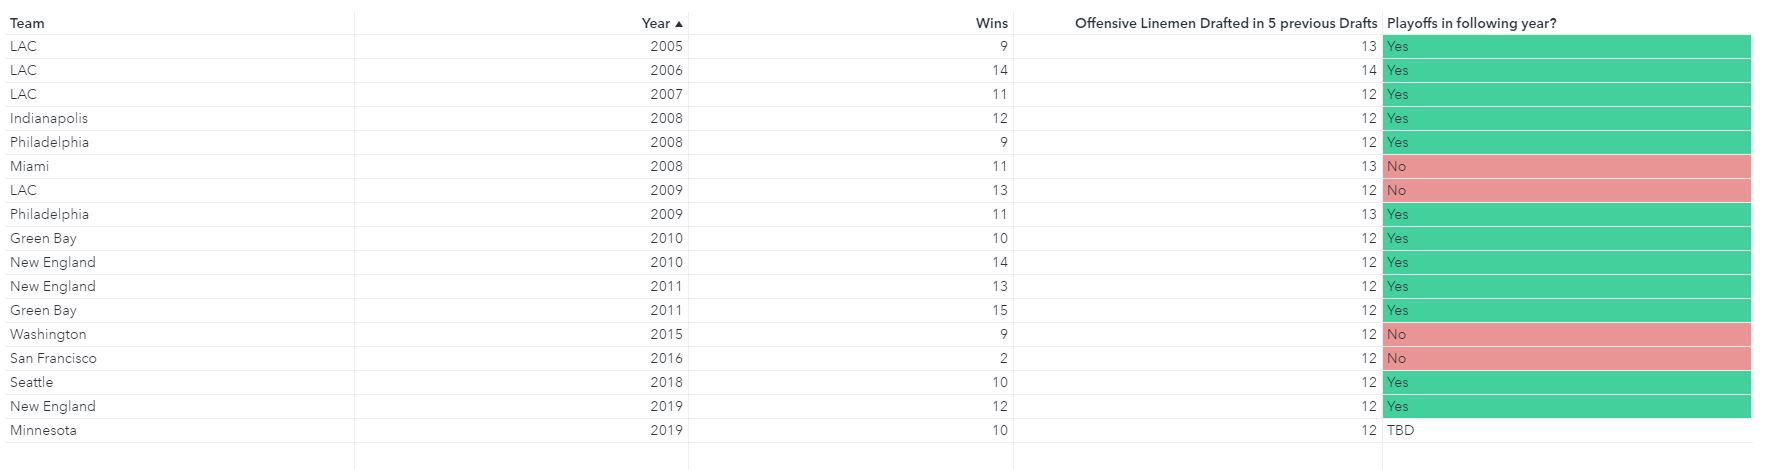
- 17 teams drafted 12 or more offensive linemen in a five-year span. Of those 17 teams, 15 made the playoffs the following season (88%).
This simple analysis shows us that successful teams are ones that spend a lot of draft capital on the offensive line. This trend is further proved out by simple linear models. I modeled wins and Offensive DVOA (defense-adjusted value over average) using the number of offensive linemen drafted in the last five years as the only input/predictive variable. I found that both linear relationships are statistically significant.
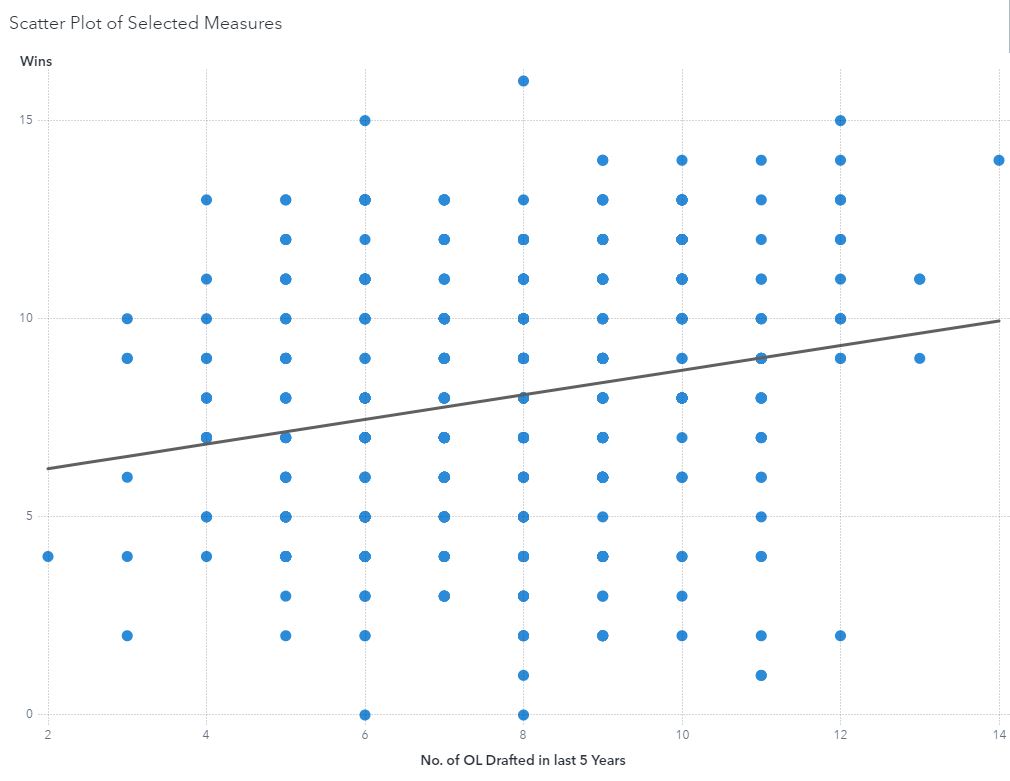
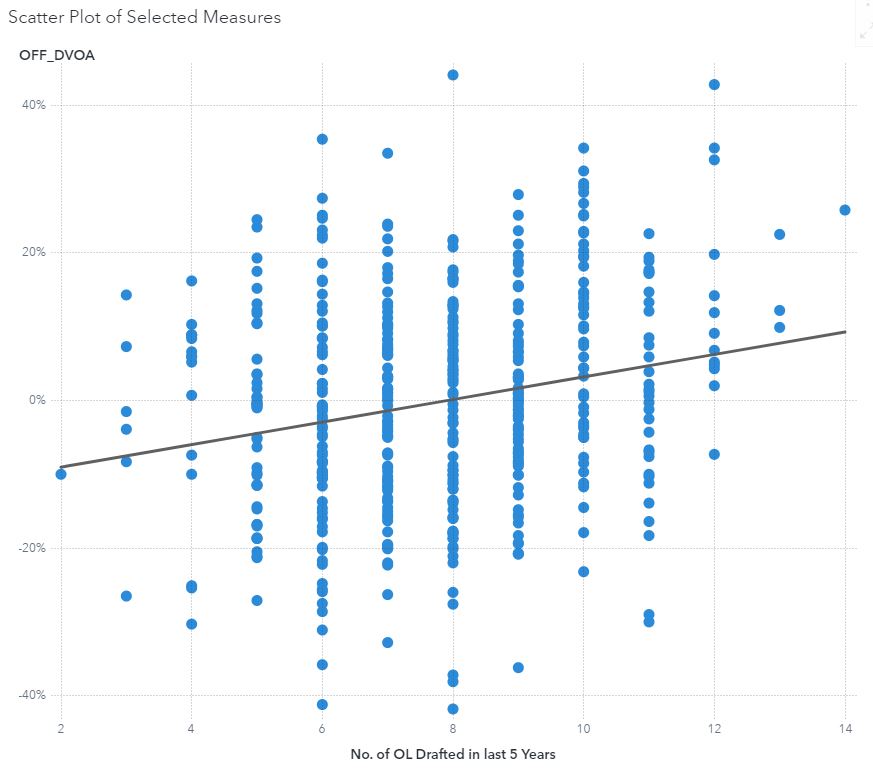
The relationship is clear: drafting more offensive linemen has a positive trend with how a team will perform.
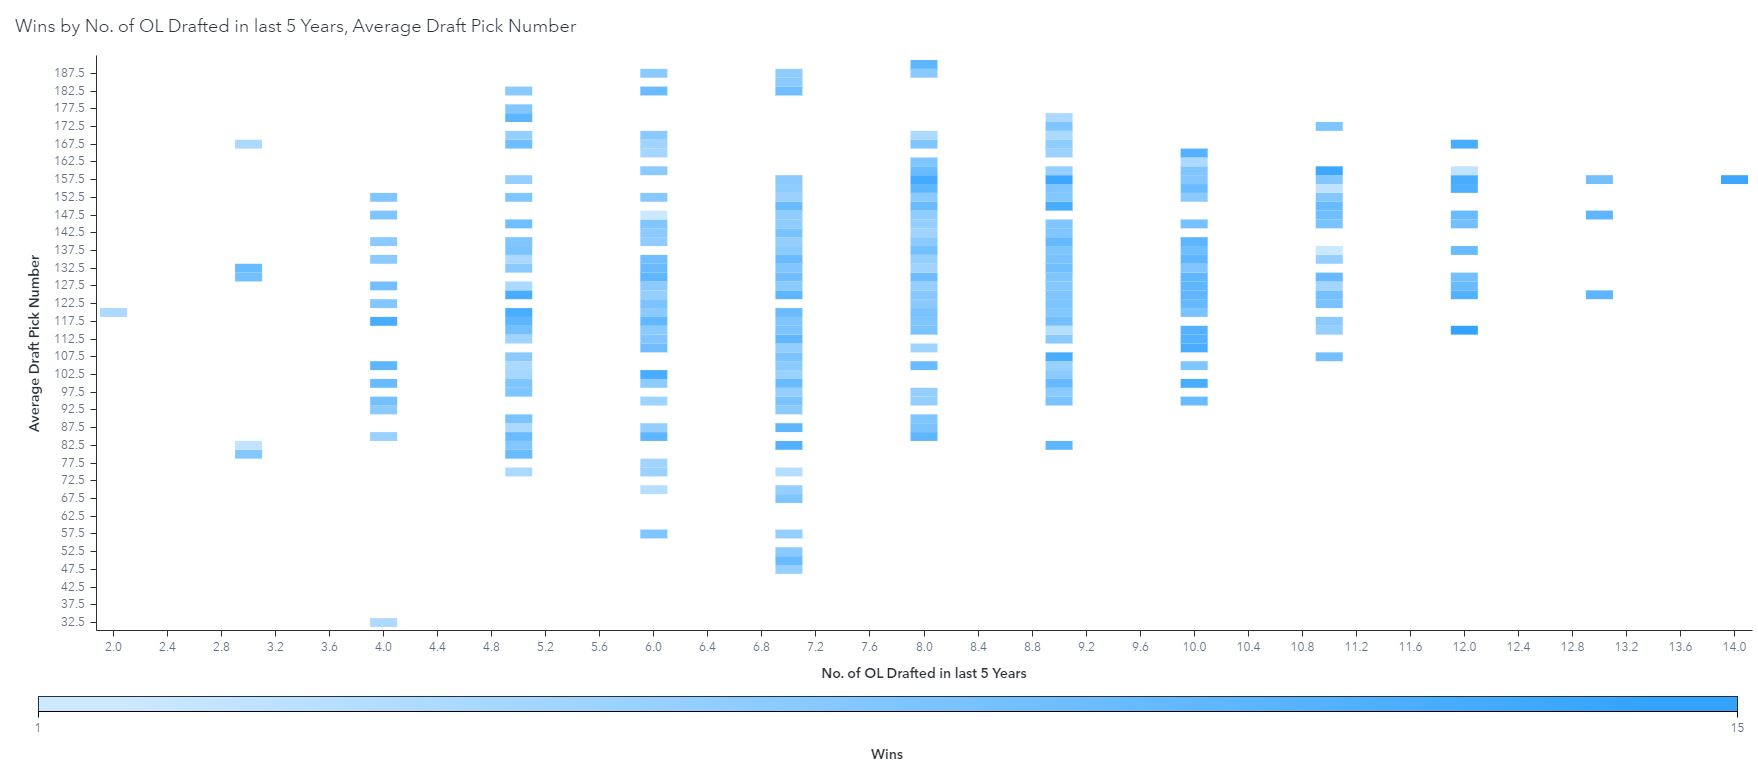
While the amount of offensive linemen a team picks seems to matter, WHEN in the draft they are selected does not appear to matter as much. The figure below shows there is no apparent relationship between the average draft order that a team selects an o-lineman and winning. In other words, there is no discernable difference between teams that selected offensive linemen early in the draft versus later in the draft – so long as they select offensive linemen period.
Investing in the offensive line through salary
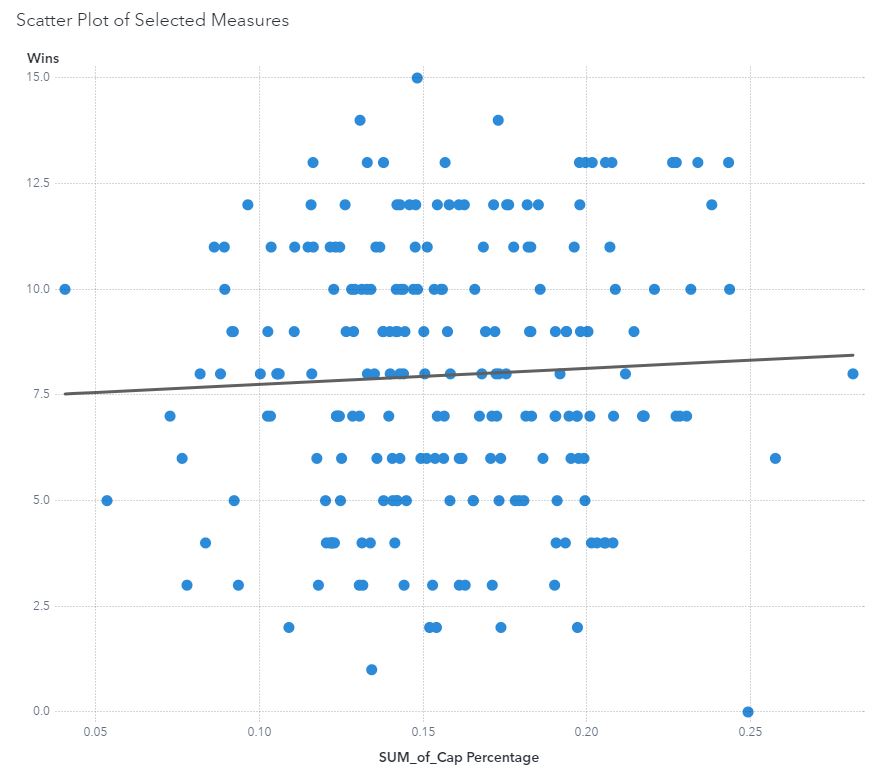
Unlike investing draft capital, there does not appear to be a discernable relationship between teams spending more of their available money on offensive linemen and team performance.
Teams have a limit on how much they can spend on players each season. That limit changes each year, so I divided the amount each offensive lineman earned in a season by that year’s salary cap limit. Then I analyzed the relationships between the salary cap percentages of each team’s offensive line to wins and offensive DVOA. Special shoutout to Jason at overthecap.com for providing some of this information.
There were no statistically significant relationships between wins and percent of salary cap spent on the entire offensive line. In other words, the secret to winning more football games does not lie in spending more money on the O-Line than everybody else. The same was true for the relationship between offensive DVOA and the offensive line’s percent of salary cap.
Do certain positions on the offensive line matter more?
One would think that each of the five positions along the offensive line matter equally. However, left tackles are paid much more handsomely than right tackles. As recently as two years ago, left tackles were still the second highest paid players behind quarterbacks, and according to OvertheCap’s data, left tackles had an average cap hit of $986,733 more than right tackles in 2019 and $1,262,805 in 2020.
This allocation of resources appears to be flawed. I found evidence that teams should more divert money from the left side of the offensive line to the right side.
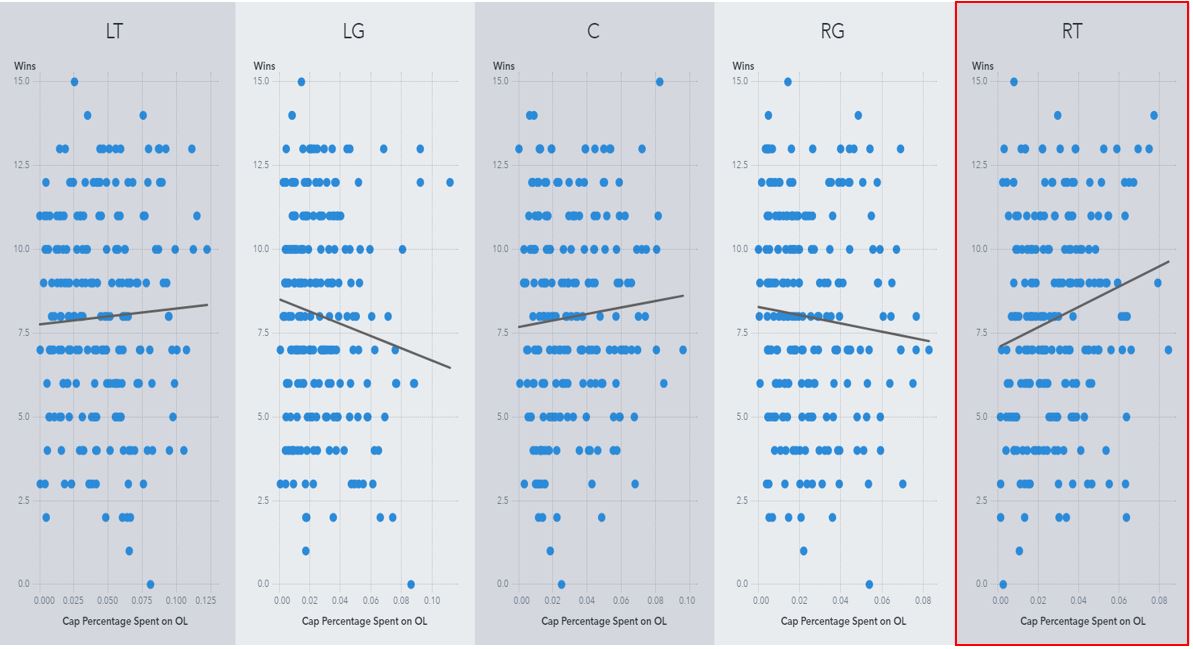
First, using the salary cap dataset from before, I found that there was a statistically significant, positive relationship between the amount of salary cap spent on right tackles and wins/Offensive DVOA. The other four positions on the offensive line did not show a statistically significant relationship between the two.
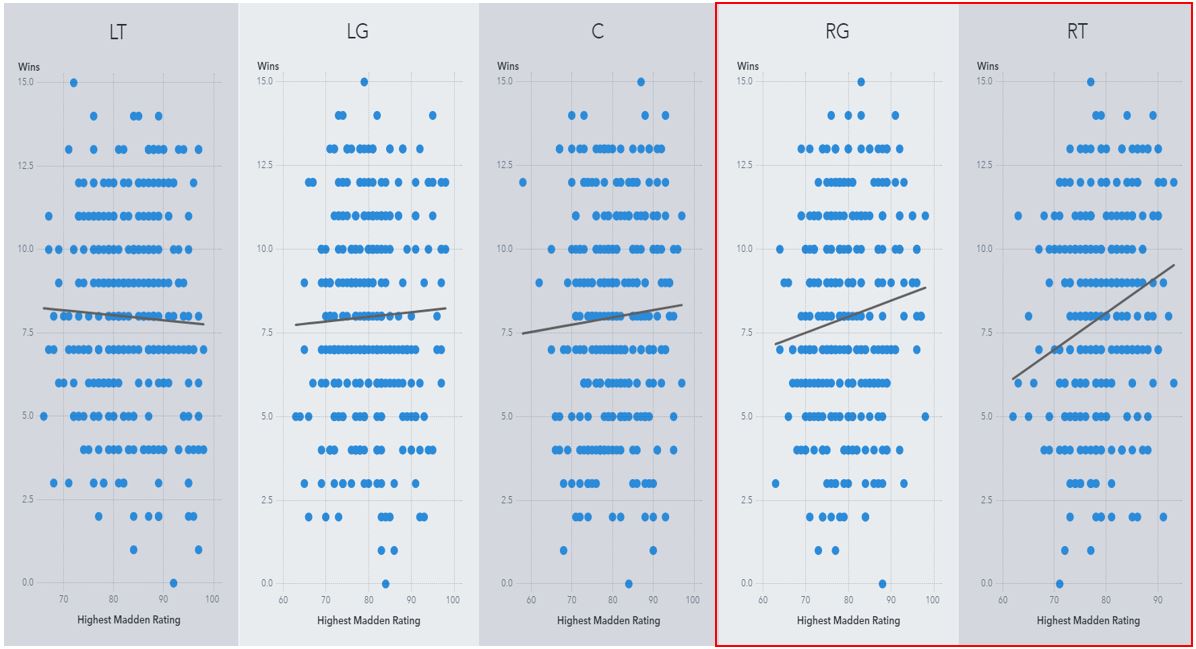
Second, using data from the video game Madden, I once again found that there was a statistically significant, positive relationship between the right side of the offensive line and wins/Offensive DVOA. The higher the rating for the right guard and right tackle, the more wins/the better the offense performed. The same could not be said for centers or the left side of the offensive line.
Conclusion
Offensive linemen are essential to every single offensive play. The same cannot be said of other positions. Teams should clearly invest more draft capital in the o-line because having youth, depth, and cheaper salaries committed to blocking a team’s most valuable asset (the quarterback) seems to correlate well with winning and overall offensive performance. One possible reason for this is because offensive linemen appear to suffer more head injuries than other positions.
Teams can also invest in their offensive line in a few other ways not analyzed in this blog. They can pay a premium for the best offensive line coaches. They can also invest more in their scouting departments in order to ensure that they find the best available players. Also, since there isn’t a lot of structured data we can capture about offensive linemen, teams should analyze unstructured data that can be written about players in high school or college. Investing in technology can only improve a team’s chances of finding the next hidden gem in future drafts.

4 Comments
Frank, interesting data. It is counter intuitive that the RT and RG would matter move. Most QBs in the NFL are right-handed so the LT and LG (to a lesser extent) protects their blind side and LTs command usually a greater salary than any other position. However, the NFL is placing a higher premium on offensive linemen that can play multiple positions vs. specialize in one position.
Great point, David! I think another reason RTs and RGs are mattering more is because quarterbacks are increasingly more mobile. All the good, young quarterbacks today can tuck the ball and run.
Great post! I'm excited to see how spatial analytics changes our stats for offensive linemen. Just like we can track the maximum velocity of a wide receiver, we can measure how far off the line of scrimmage linemen push their assignment or how often they are beat or if their movement ends up being ineffective to the play as a whole. But the historical data isn't quite there yet. Looking forward to seeing what the future holds for accurately identifying the value of the Brute Squad.
I'm also excited for using tracking data to evaluate offensive linemen! I'm sure teams are doing cool stuff internally that they won't share with the public haha