 Critics of sports analytics (and there are some entertaining ones) love to point out that analytics isn’t capable of capturing the things that don’t show up on a box score. A player who dives on the floor to save a loose ball, a quarterback strategically misleading a defender to free up his receiver, or a goalie who yells excellent instructions to his teammates -- the critics say these qualities can only be captured by the eye.
They're correct that traditional, structured data points currently measured in sports do not have a way to account for many plays that are only noticed by the trained eye. However, scouting departments have unknowingly been capturing this type of data for as long as scouting departments have existed. Everything a scout or a coach can see and write about is unstructured data just waiting to be mined and analyzed.
Let's take a look at how unstructured datasets can be used in sports to measure a player’s abilities and project a player’s future performance. Publicly available NBA scouting reports from 2009-2015 will be used in this analysis. The scouting reports were all written before each player was drafted, making them perfect candidates for a predictive model. The question is: Can text data alone be a good predictor of how good an NBA player can become?
Unstructured to structured data
In order to analyze unstructured data, it must first be put into a structured format using text analytics models. From there, predictive models will be built on the text analytics outputs. There are several ways to use text analytics models to take an unstructured data set, such as a scouting report, and turn it into a traditional, structured data set with rows and columns. For this analysis, two methods were used: rules-based categorization and algorithm-based topic creation.
The first method requires human-written Boolean rules to categorize the entire scouting report. In essence, a "point" is given for every strength or weakness category mentioned in a scouting report. For example, take the following sentence:
Michael Kidd-Gilchrist (MKG) is a very athletic player who struggles to shoot from outside.
Two categories are hit by this one sentence. MKG would fall under the ‘athletic’ and ‘poor shooter’ categories. Seventeen rules-based categories were created for the publicly available NBA scouting reports used in this analysis.
The second method leverages SAS’ natural language processing capabilities. The algorithm essentially looks for words that appear frequently together, then scans through each scouting report to see which of those words appears in the document. For example, the most common topic in this exercise contained the words "throw," "free," and "line." Obviously, documents that used these words together were talking about a player’s free throw shooting ability. Hundreds of algorithm-based topics were created from the publicly available scouting reports.
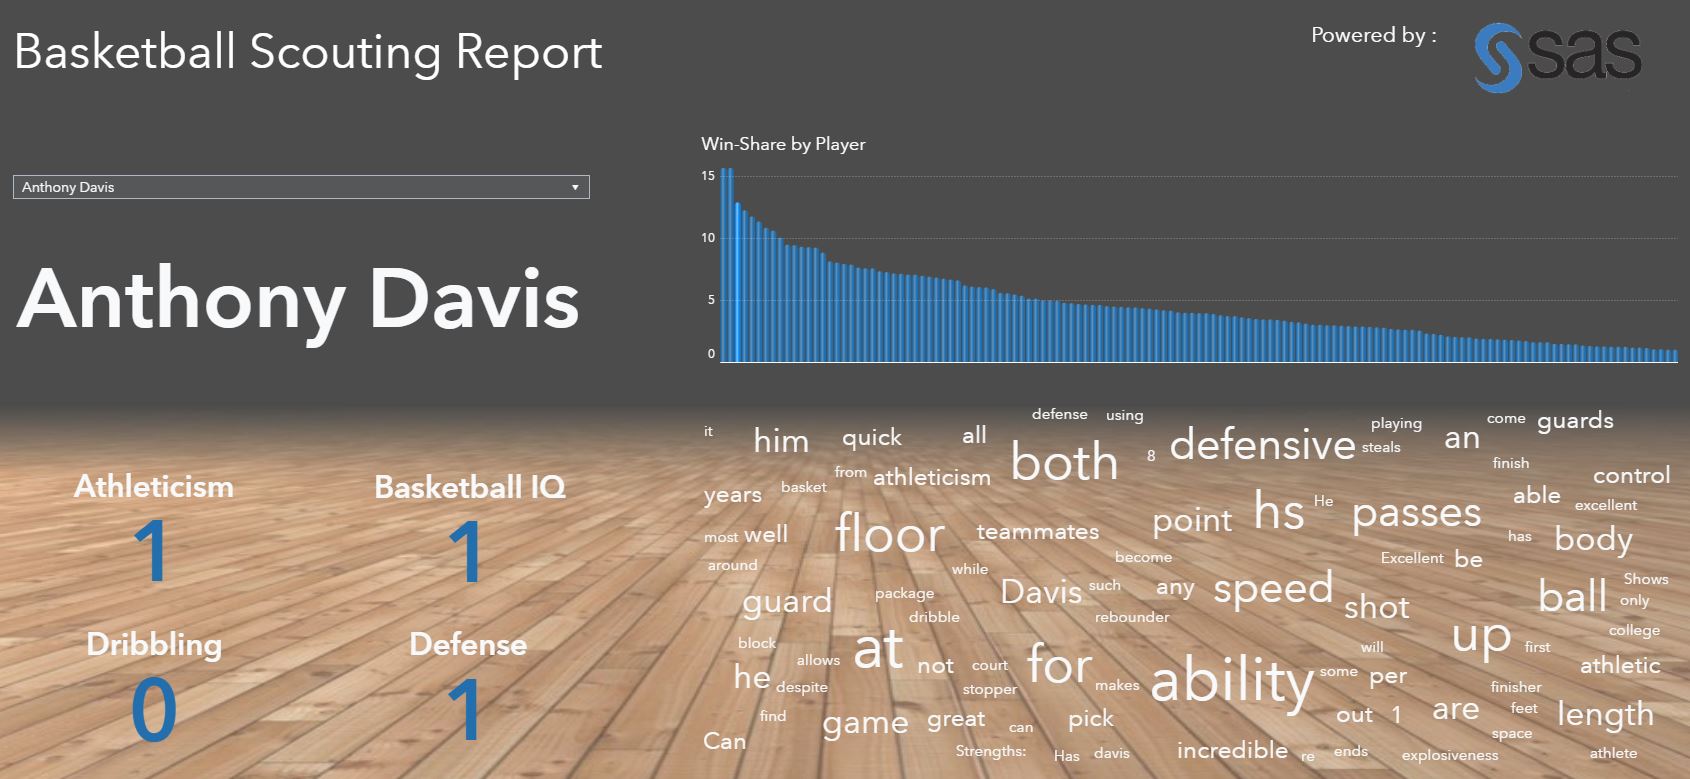
The report below displays four of the 17 rules-based categories. Anthony Davis’ scouting report mentioned strengths in his athleticism, basketball IQ, and defense, but not for his ball-handling.
Predicting future performance
One scouting report per player for about 900 players drafted between 2009-2015 were analyzed by the text analytics methods described above. The data set resulting from the text analysis was used to build predictive models to project a player’s future performance. The average of a player’s three highest win-shares per season was used as the target variable to predict a player’s future performance. Players drafted after 2015 were not included in the model because they, presumably, have yet to play their best seasons.
*Side note, win-shares is not a perfect measurement. For example, Tim Duncan’s average WS for his three best seasons is lower than LaMarcus Aldridge’s. Ask any Spurs fan if that reflects who had a better career. There is no such thing a perfect measurement to evaluate a basketball player. Win-shares does a decent job of approximating who the best players are, which is why it was selected for this model.
The predictive model results were promising. While the predicted values of the win-shares themselves were off, the rankings of the players with the highest win-shares were reasonably accurate. The image below shows the top ten players predicted to have the highest win-shares, based on the data mined from the unstructured scouting reports alone, and the top 10 players in actual win-shares.
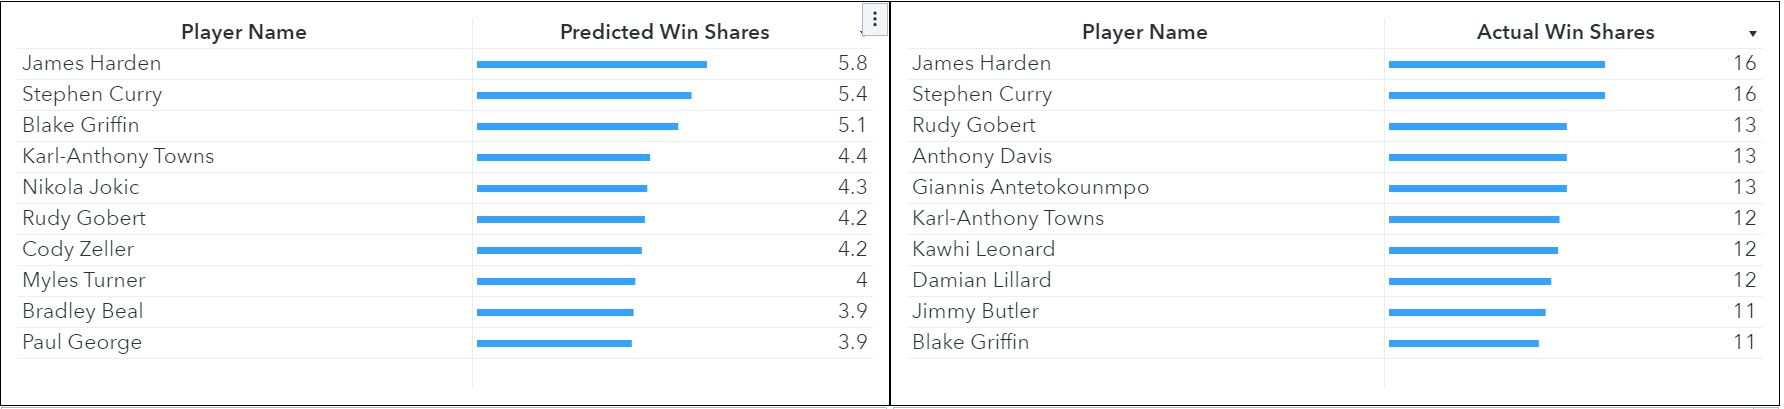
There are some obvious omissions in the prediction, like Anthony Davis and Giannis Antetokounmpo, while other players were ranked too highly by the model. However, the text models cannot entirely make up for any mistakes a scout makes. If a coach or a scout writes an extremely flattering scouting report about a player who actually can’t play (or vice-versa), then the model might expect that player to become a future all-star.
To improve the accuracy of this analysis, many more scouting reports are needed. The more text data we have written about a player, the better the model can perform. Also, having more scouting reports means differing opinions from different scouts can be picked up. For example, one scout might notice deficiencies in a player’s game that another scout doesn't.
Where do we go from here?
Teams from every major sports league can benefit from using text analysis. Having an algorithm scan what scouts wrote for each player not only saves a lot of time but also picks up on patterns of words used for players that eventually become good. If an algorithm can identify traits of good players, then it can evaluate players without any bias that a human might have. For example, a player’s age, the school they played at, or where they’re from might bias how NFL GM’s make draft choices.
Critics of sports analytics have a point when they say data doesn’t tell the whole story. Traditional, structured data does not paint the whole story. However, including unstructured data sources vastly improves any analytics a team wants to do. The applications do not stop at just predicting the future performance of incoming professional players.
Text analysis can help teams with game day and fan experience operations as well. Check out this blog examining how Yelp reviews can help teams and businesses improve the fan experience at an NBA arena. Also, be sure to check out the SAS Visual Text Analytics page for more information about the benefits of analyzing unstructured data.

5 Comments
Very cool, Frank! It's exciting to see what insights can be gleaned from unstructured text analysis across many different domains!
Thank you for the kind words, Biljana!
Great read, Frank!
Well written and great content Frank! It’s not about either/or, analytics/scouting, it’s both combined that creates a better view from more angles. Like adding an x-ray machine will help any medical team.
That's a great analogy!