Being a state governor has never been more difficult than right at this moment, because the extreme steps governors are being forced to take in order to protect their citizens’ health are having an equally extreme impact on other critical aspects of our society. In the face of social distancing lockdowns, companies are laying off employees, small businesses are shuttering (perhaps permanently), churches and charities are seeing a precipitous decline in donations, and in some areas crime is rising.
Governors and their staffs are acting with unprecedented speed, agility and focus in order to manage effectively through this unfolding crisis, avoiding further unnecessary catastrophe. We know firsthand, because we’ve been working side-by-side with a number of them. The citizens they serve know it, too.
For governors, data – good, accurate, timely data – has emerged as perhaps their most precious tool for taking decisive, effective action to counter the virus and its ripple effects throughout their states.
That’s because governors need answers to a rapidly cascading set of interrelated questions to understand what’s really going on at the state level, and more importantly what they should do next:
- Who’s sick – and where is the virus spreading next?
- Which communities are in greatest distress today, and which will be in the coming days or weeks?
- Is crime on the rise? What type of crime? Where is it taking place?
- Who’s unemployed, and where do they live?
- How much are tax revenues falling, and how much further are they likely to fall? What impact will that have on budgets developed before the virus hit?
- Are small businesses receiving the capital they need, when they need it?
- Are the most vulnerable in society – children and the elderly – receiving food, medicine, and other critical services?
These are only a sampling of the types of questions racing through governors’ offices in every state today. And, fortunately, the data required to answer them is available. But that doesn’t mean it’s easily accessible, nor that anyone is analyzing it effectively to generate insights in time to actually make a difference. Months from now, when the country looks back at which governors mounted the most effective response to the challenge of this moment, their access to actionable, data-driven insights will be the dividing line. Simply put, governors who are using good, accurate, timely data can make better decisions than their peers who do not have the same access.
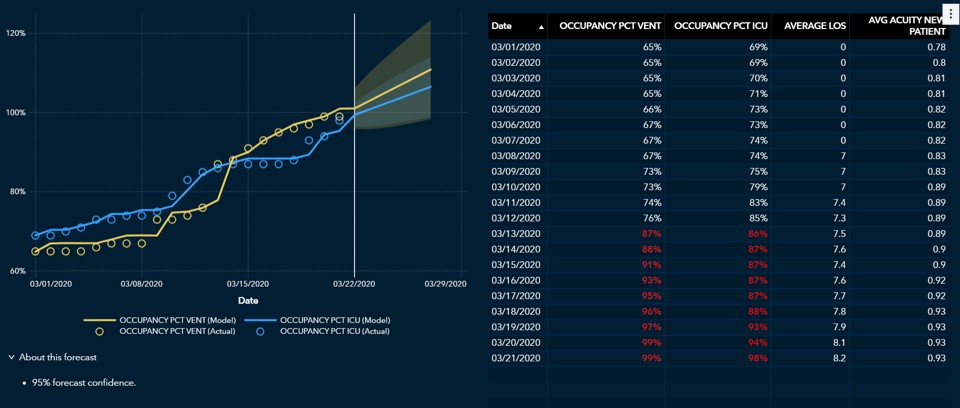
Governors typically have a number of dashboards in place to inform their decision making on key issues – and the pandemic is no exception. Regardless of what it’s called – a Pandemic Response Dashboard, or a Pandemic Response Command Center, Pandemic Data Portal, etc. – the goal is situational awareness for decision making. Our work with several governors to date suggests that there are six critical categories of data that must be included in these dashboards to deliver true situational awareness, drawing from state agencies and local governments:
- Public health – including test results, confirmed cases, and recoveries
- Medical resources – data on number and location of clinicians (doctors, nurses), hospital beds, medical equipment, and supplies.
- Employment – new and existing jobless claims by location and industry.
- Crime – statistics on crime trends by location, including identification of “hot spots.”
- Essential workforce – number, location, and availability of police, fire, first responders, national guard, and other people whose jobs are critical in keeping social order.
- Tax collections – total collections from key revenue sources such as sales/use and employer withholding, with a particular focus on communities in which there is a dramatic decrease in these measures.
With ready access to data in each of these areas, governors can determine what’s happening today. That’s incredibly important in the midst of a crisis that's changing facts on the ground significantly from hour-to-hour and day-to-day – and it’s the approach that governors are already putting in place. “I operate on facts and on data and on numbers and on projections,” New York governor Andrew Cuomo told reporters on March 27, 2020. “Not ‘I feel,’ ‘I think,’ ‘I believe,’ ‘I want to believe.’ Make the decisions based on the data and the science.”
Even so, it’s not enough to know what’s happening today. Governors need insight into what’s likely to happen in the near future. Proactive governors are already asking “What will happen next week? What about next month?” That’s where a pandemic response dashboard can make all the difference.
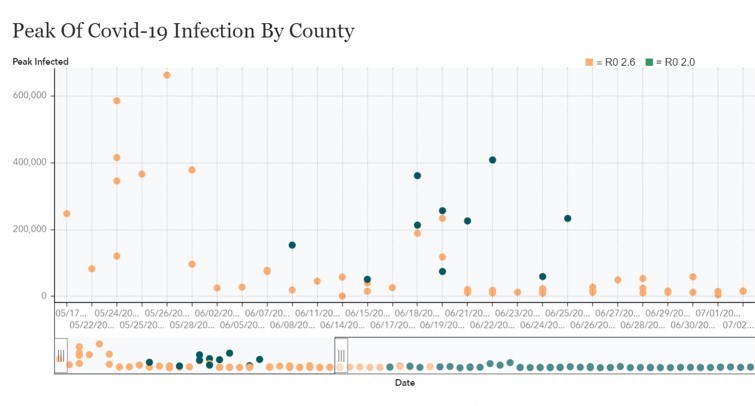
With a little extra work, governors can use the underlying data to forecast the impact of the pandemic in communities across their states. They can simulate what happens in “best case” and “worst case” scenarios. In short, they can use data to think beyond immediate needs. They can smartly anticipate needs – getting help to vulnerable communities before a crisis exacts an even greater toll.
If you’re a governor, serve on a governor’s staff, or head up a state agency that reports directly to the governor’s office, this type of dashboard could be up and running in your office quickly – and the benefits to the rapid-fire decision making underway right now in every state would be significant and impactful. Because in the end, data is one of the most important determinants of a state’s ability to successfully respond to this unprecedented challenge. Our lives, our livelihoods, our economy, and the functioning of our society at large all depend on it.
We want to help. Please feel free to call me at any time, or just drop me an email (grant.brooks@sas.com), to determine whether and how we can help you get a dashboard up and running, fast. You can also visit our COVID-19 resource center for more information on how SAS can help in the midst of this unprecedented challenge, or contact us using this short online form.