“They were the best of asteroids, they were the worst of asteroids.” ~ Charles Dickens Armstrong
 There are good asteroids, and there are bad asteroids. Good asteroids stay in their own neighborhoods and wait for us to come visit them. Bad asteroids, however, don’t wait for an invitation – they could potentially visit us in our own home, any time.
Oh, and bad asteroids are bigger, about 40 times bigger, measuring about 2 km in diameter. They impact the Earth roughly once every 500,000 years with a force of 45,000 megatons. That's about seven times the strength of our current global nuclear arsenal. So when they hit, they destroy everything within a 150 mile radius. Bad. Very bad.
At least that’s what a summary look at a couple of NASA asteroid data sets tells us.
- One data set covers approximately 500 Potentially Hazardous Asteroids (PHAs) – those Earth-crossing asteroids within 0.2 astronomical units that might one day represent a threat to life on the planet.
- The second data set of 65 Accessible Near Earth Asteroids (NEAs) represents an initial target list of potential asteroids which could reasonably be visited by human or robotic spacecraft.
While both data sets are a bit sparse, you can still learn a lot about our little corner of the solar system with even a basic visual and summary analysis. Let’s start with the good asteroids, the NEAs.
Near Earth asteroids
Although there are only 65 observations in this data set, it contains estimates of both diameter and absolute magnitude. These measurements will help us estimate diameters for the bad asteroids later, which only come with magnitude values. And while it’s reasonable to assume that the brighter the object (in absolute terms), the larger it's likely to be, it’s nice to see that the Pearson correlation analysis between these two variables is -0.97 with a probability of <0.0001 that this correlation is spurious.
[Note: SMALLER numbers mean larger brightness magnitudes. As the numbers get larger the objects get dimmer and less visible. The naked human eye can detect up to about a magnitude 6.5 star in the night sky, whereas my 250mm Schmidt-Cassegrain telescope can detect up to about a 15 on a good night; Galileo’s first 1.5” telescope was capable of about magnitude 10 objects. Magnitudes are exponential, not linear, they increase by a factor of 2.512 for each unit increase in magnitude, making a magnitude 1 object 100 times brighter than a magnitude 6. For the very brightest objects, magnitude can even be negative, as it is for the Sun (-26.7), the Moon (-12.6), Venus (-4.4) and Sirius, the brightest star (-1.4).]
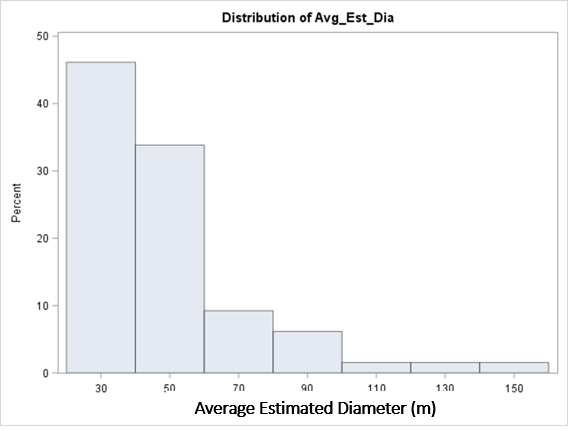
The average size of these 65 potential exploration sites is a mere 50 meters (see Graph one), with the largest at only 150 meters. Surface gravity will be negligible – Alan Shepard would easily have been able to launch a golf ball into escape velocity with his six iron. And as you also might expect, it’s the 30-50 meter objects which are most common.
But before you can hit a golf ball or search for rare minerals, you have to get there, so the primary focus of this NASA data set is the time required and the amount of energy required to accomplish the journey, measured as “delta-v,” typically in units of kilometers-per-second from LEO (low earth orbit – my favorite acronym). As you can see from the graph, most of these reside in the 4.5 to 6.0 range. For comparison, a trip to LLO (low lunar orbit) requires a delta-v of 4.0.
Pop quiz: Does it take more energy (delta-v) to get to Mars or to Venus? The answer is that they're about the same. You do not naturally “fall into the Sun” to go to Venus. Instead, you gain (Mars) or lose (Venus) angular momentum, and you have to lose about as much angular momentum when going from the Earth to Venus as you have to gain when going from Earth to Mars. Similarly, it takes just as much energy to return from Mars (or the Moon, or Venus) as it took to get there. Weird, but true.
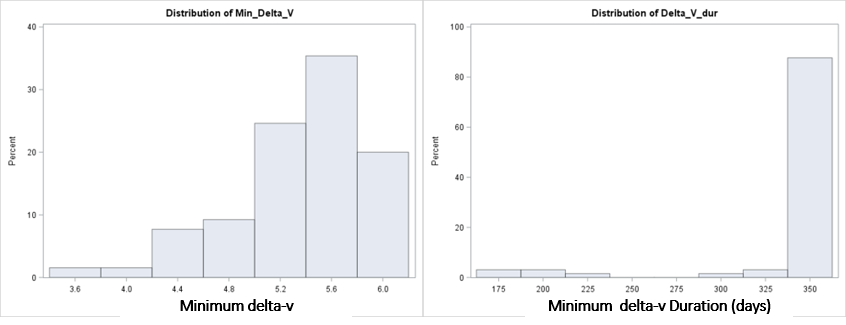
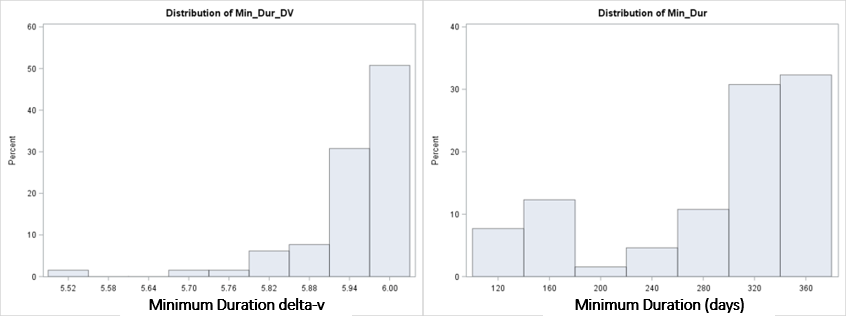
Getting back to our asteroids, it takes about a year to get to most of these NEAs using the minimal required delta-v (graph 2, above). If you want to get there faster (see Graph three, below), you can get to many of them in under 300 days, but it’s going to cost you energy – most everything is now in the 5.8 to 6.0 delta-v range.
Potentially hazardous asteroids
The bad asteroids don’t come with diameter estimates, but we can use our newfound confidence in the correlation of diameter with magnitude to estimate their size. Based on the reported magnitudes, the average diameter of an object on the NASA PHA watch list is about 2 km, or 40 times that of the NEA targets. An asteroid this size hits the Earth about once every 500,000 years and destroys everything within a radius of 150 miles via its fireball and blast overpressure.
The largest object in the collection of 498 asteroids would be about 5 km in diameter and would be expected to hit the Earth once every 10 million years, creating a continent-wide firestorm from falling debris, causing earthquakes and tsunamis around the planet, and having severe global climate effects. Day would become night for months, causing regional extinctions. Fortunately, NASA gives all of these objects a < 0.000000001 probability of impacting Earth during the calculable future.
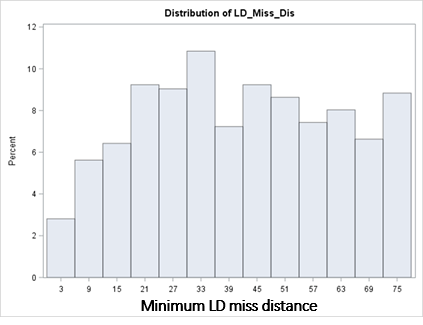
A histogram of the minimum LD (lunar distance) of these objects from Earth shows a rapid increase in their number up to about 20 LD, after which the count levels off out to the cutoff point of about 80 LD (Graph four). The dearth of nearby asteroids is likely explained by the presence of the Moon, which has gobbled up or ejected most of the closer ones already. Why the graph doesn’t continue to increase past 20 LD (theoretically, it should increase exponentially, at least by the second power, if not the third) is likely accounted for by the difficulty in detecting the smaller objects at increasing distances – they're probably out there – we just can’t see them (yet).
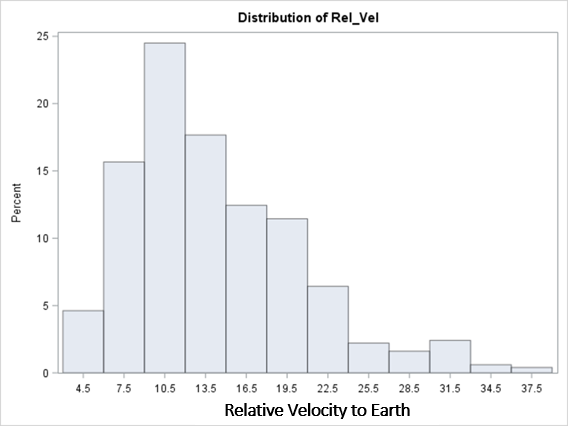
So why not visit one of the bigger, badder asteroids? The answer is once again delta-v, this time illustrated by the relative velocity histogram of the 498 PHAs (Graph five). This “bad” group moves with an average relative velocity to Earth of about a factor of 14. Assuming you could catch one as it zipped past, you’d be a long way from home after even just a short stay on the surface. In contrast, the NEAs tend to move in Earth-like orbits with relative velocities much closer to Earth’s (i.e. ~ 1.x) making them significantly more preferable as landing targets.
It’s been 66 million years since the asteroid that wiped out the dinosaurs struck our planet, and it may be tens of millions of years more before we see the likes of that again, but in the meantime there are dozens of friendlier rocks in neighborhood to which we might one day soon pay a visit.
[Note: If you'd like to learn more about how the graphs and analysis in this blog post were generated, check out SAS Enterprise Guide].