Can you use a data visualization tool to display building maps, floor designs and other Esri data?
With the recent addition of custom polygon support in SAS Visual Analytics 8.2, customers wondered if this feature can be utilized to render different types of regional overlays. A common request is to include floor or building maps in reports. This post covers not only the actual polygon registration in SAS Visual Aanalytics but also highlights related steps to build such boundary data using Esri desktop tools.
Getting the data
Floors, buildings or any other shapes are typically represented as polygons and delivered in form of Esri shape files. If you have data available already, you can skip ahead to the section Import polygonal data to learn how to import your data into SAS Visual Analytics.
Often, however, you don't have data available, or you have special custom regions you're trying to render. In this case, you need to create the polygon data first. You can use open source products, such QGIS, or commercial products, such as Esri's ArcMap to create your data.
For this example, I'm going to use Esri ArcMap and use the floor layout of the Colorado Convention Center in Denver. As you may be aware - this year's SAS Global Forum is going live on April 8th, 2018 in Denver.
In order to generate polygons representing rooms in this convention center, the following steps are required:
- Download a floor plan layout in a format such as PNG/JPG image.
- Georeference the image if not done already.
- Generate polygons representing each room and export into Esri shape file.
- Import the shape file into SAS Visual Analytics and register a new custom polygon provider.
- Visualizes polygons in SAS Visual Analytics.
The floor plan
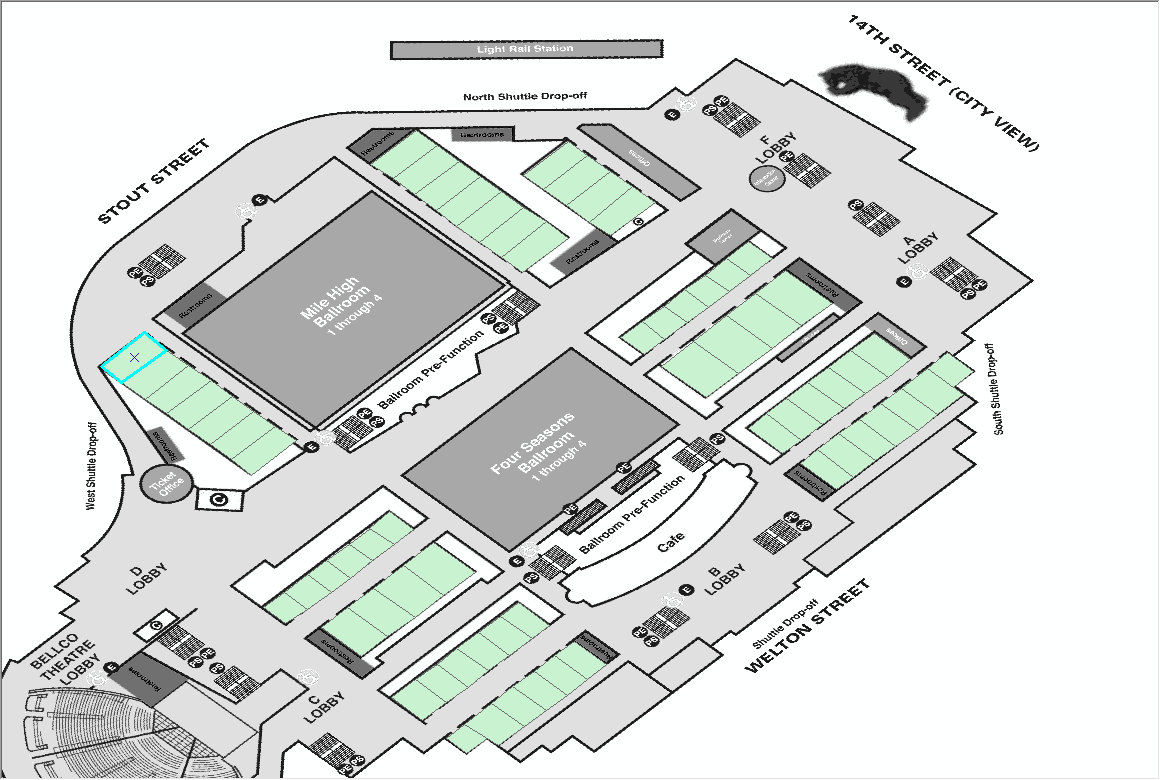
Looking at the Convention Center Directory, the room layouts are provided as PDF downloads, or you can just download the related JPG as embedded in the web site. I'm going with the floor plan in JPG format for the meeting room level. Always try to get the highest resolution image available - you will be rewarded later with more clear and detailed rendering of the geomap.
Georeferencing your data
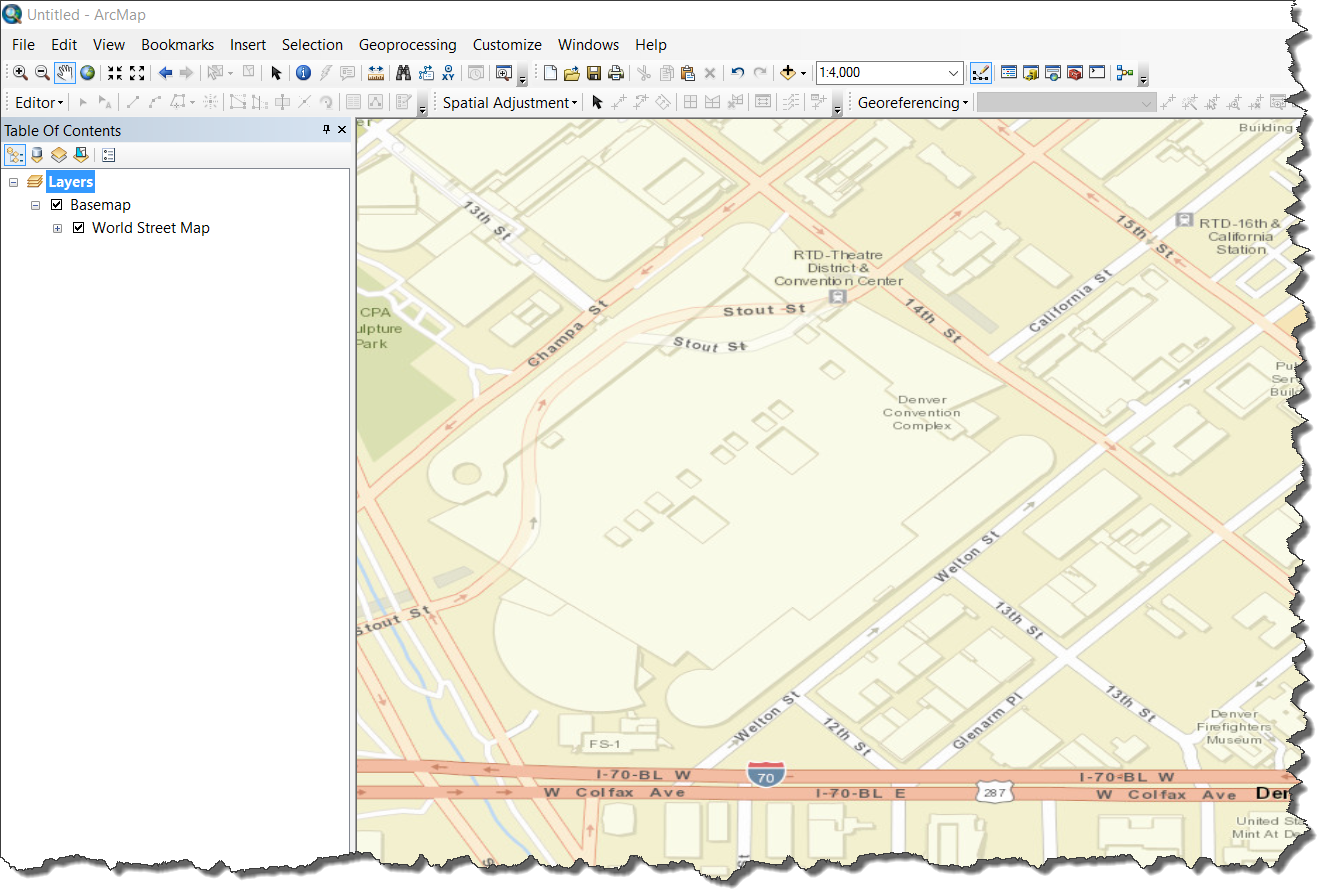
Georeferencing is the process of aligning an image or other overlay to the exact geographical coordinates on earth. Applications such as Esri's ArcMap make georeferencing images very straightforward. I'm starting off with a new blank map document in ArcMap. In order to reference geographical points more easily, I'm going to add a geographical map background as the first step (File->Add Data->Add Basemap). The World Street Map for example has sufficient details for me to georeference the floor plan image.
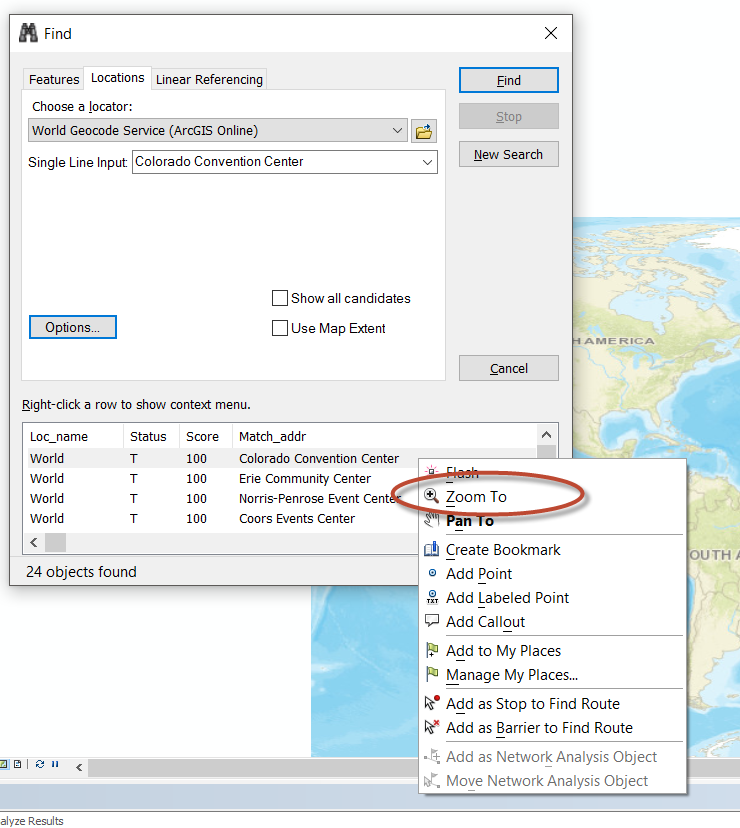
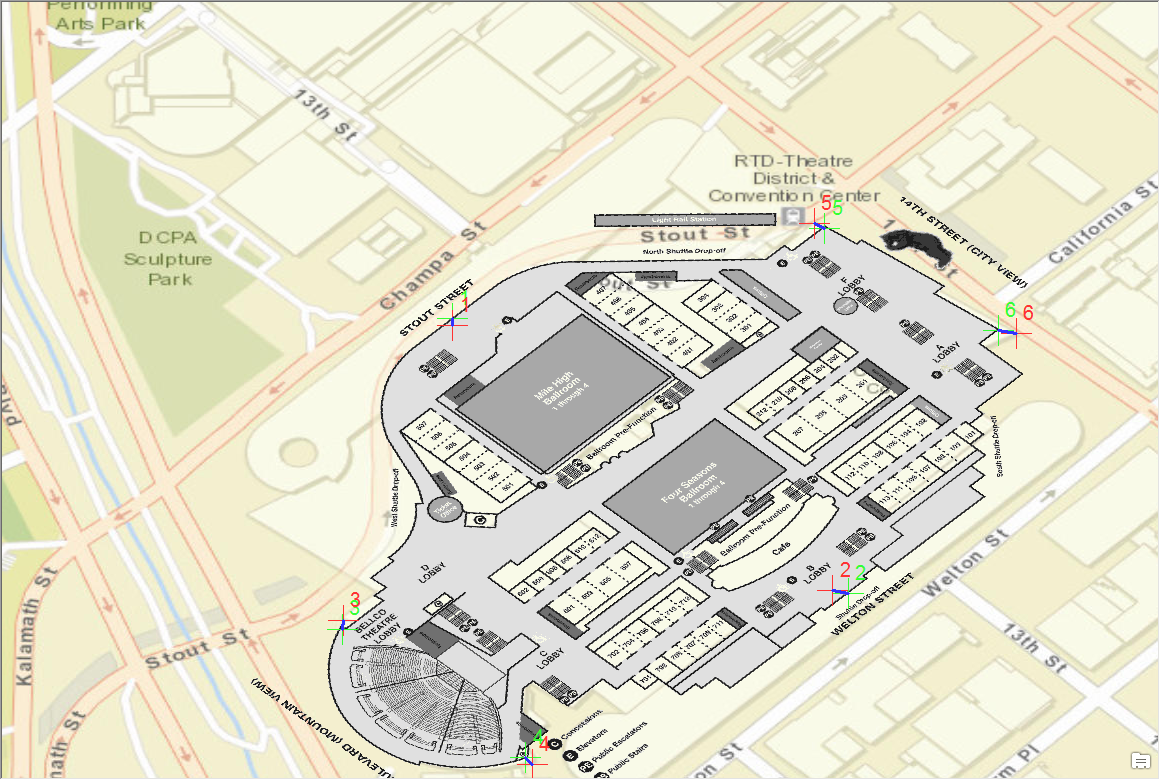
The built-in location search lets me quickly find and zoom into the convention center area:
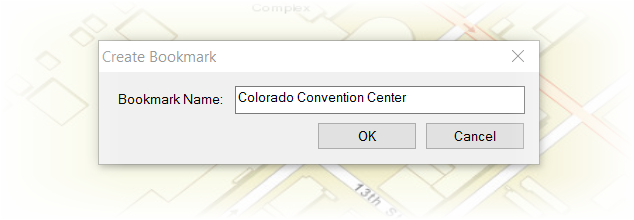
Tip: In order to quickly move back to this location - it is useful to create a bookmark (Bookmarks->Create Bookmark):
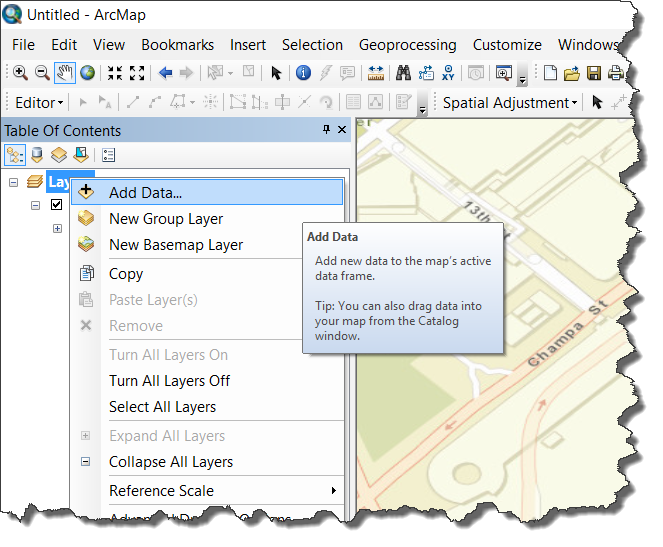
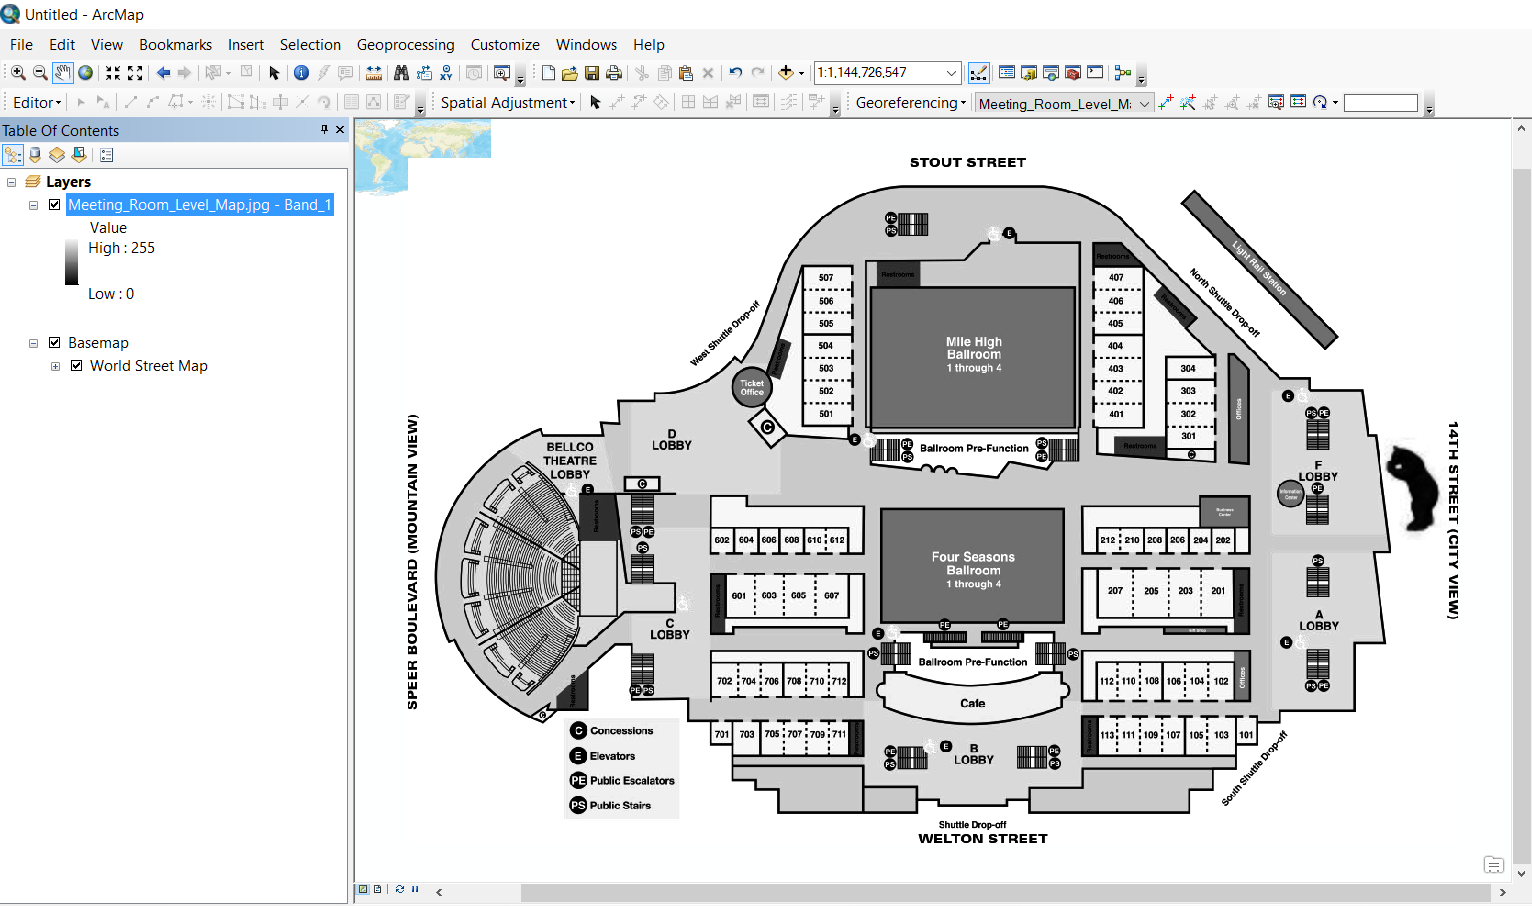
We are now going to add our image on top of this base map (File -> Add Data -> Add Data). In the dialog provided, just select the floor layout image downloaded earlier and select the first band.
Once added, you may not actually see the floor plan, since our image doesn't have any georeferences, which puts it outside our default coordinate system.
Right-click on the layer in the table of contents and select Zoom To Layer.
Right click somewhere on the toolbar and add the 'Georeferencing' toolbar. We are now going to map a few reference points on the floor plan with the same location in the base map. Select the 'add control point' icon:
![]()
And select a point which is easily recognizable in the base map later. I'm going for the outside of the round Bellco Theatre:
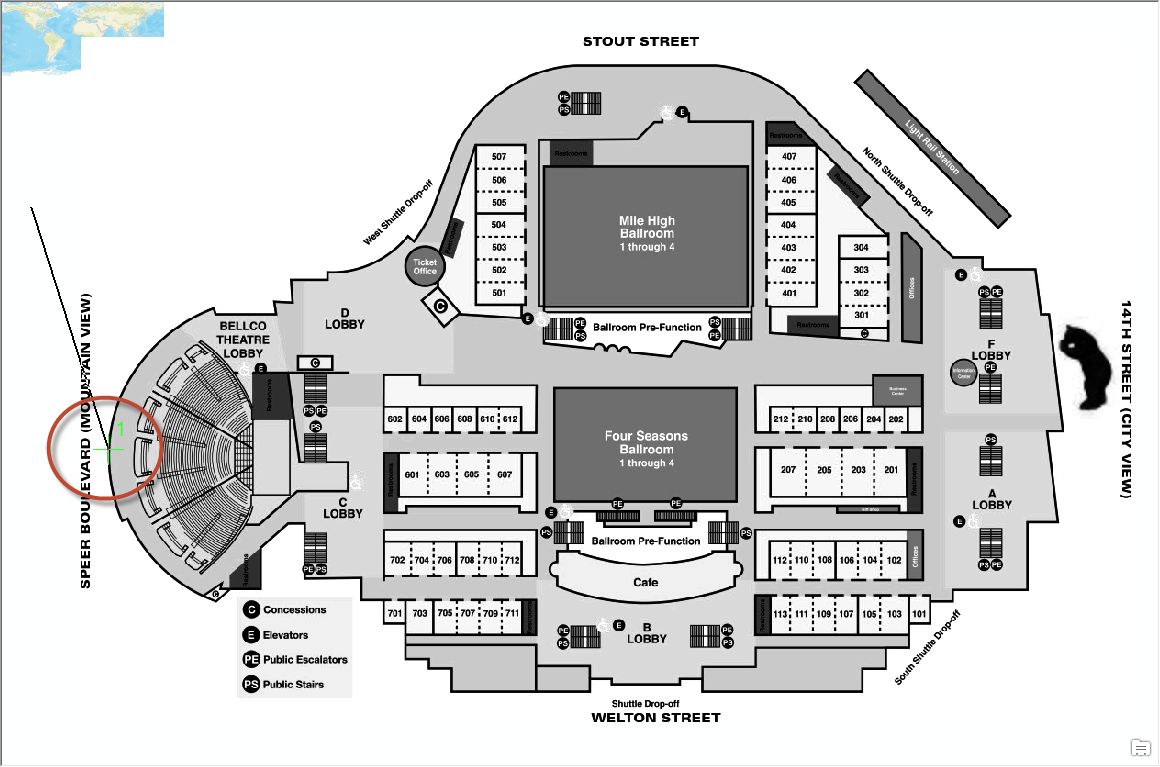
Once selected, we need to select the reference point in the base map. It now comes handy to have a bookmark created before. Just use the bookmarks menu to zoom back into the Denver area. Alternatively, perform a location search. Then simply click on the same location in the map.
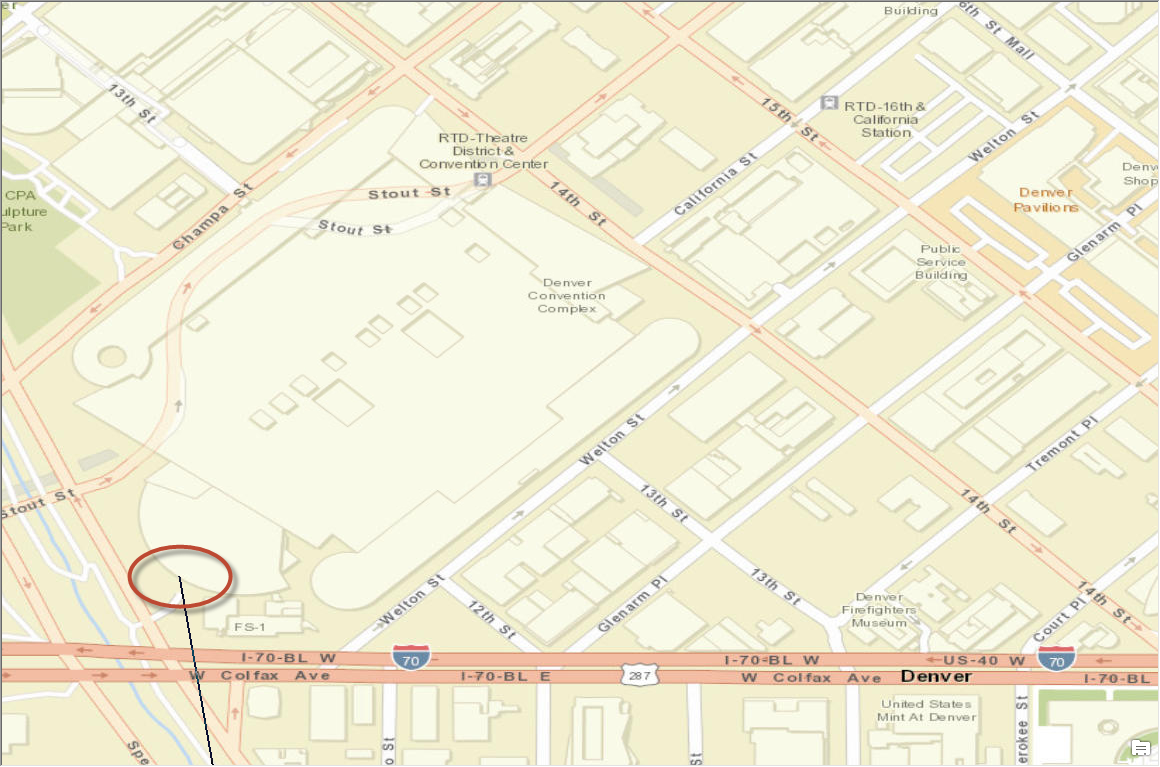
ArcMap will now automatically adjust the image location and scale with every new added control point. As such, you may now see the image overlap and hide the base map. In order for you to select additional points, you may have to toggle visibility of individual layers using the table of contents. For some reasonably good georeferencing, select at least three control points.
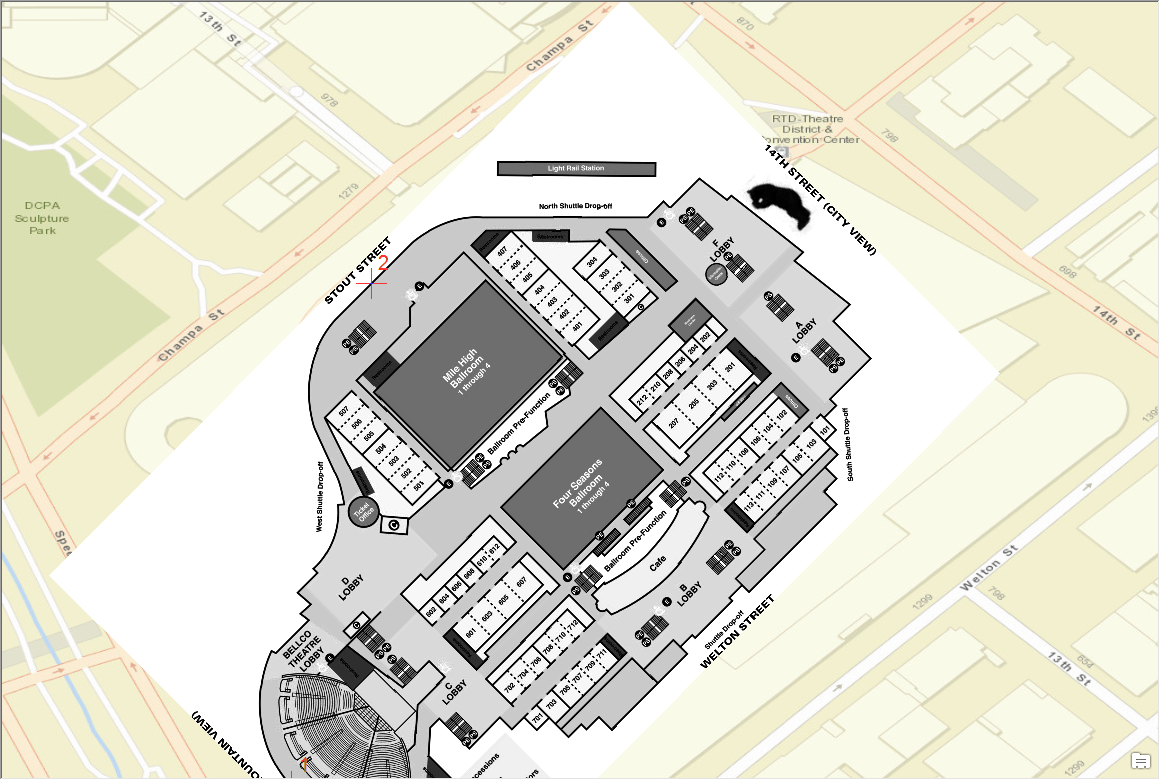
Tip: For better overlay and easier reference, you may want to remove the white background of the floor plan. Open the layer properties and generate 10 classified distinct color ranges. Finally select "no color" for white, which should make the related color range transparent.
Our final, georeferenced image renders like this:
Generating polygon data
We now have a geographical map with information about each room in the convention center. If you have access to a private/on-premise Esri server, you may register this map as new map service (File->Share as -> Service). This way you can use the detailed information provided in the floor plan as great reference in Visual Analytics. See the SAS Visual Analytics Administration documentation for more information how to register custom Esri servers in the underlying map micro service.
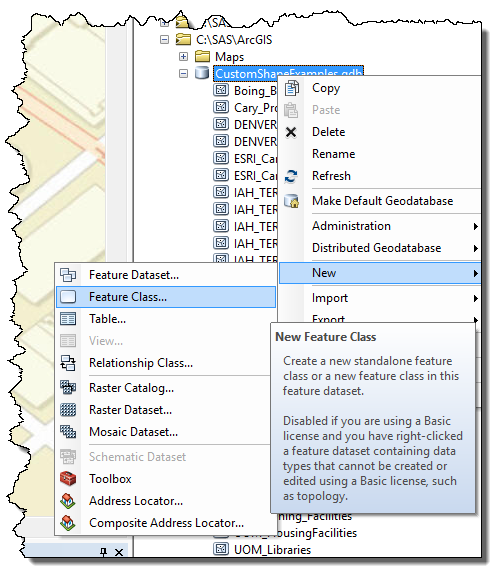
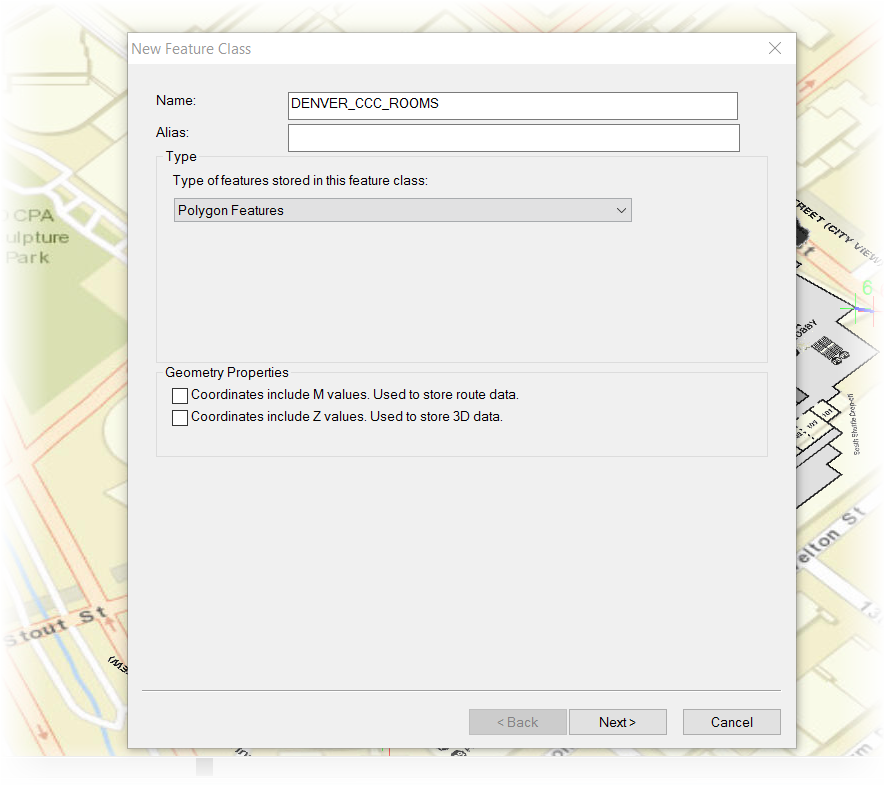
We can also use ArcMap to generate polygons for each individual room. In order to store our polygons (or features) we need to create a new feature class first. Select a geodatabase of your choice and create a new class. Make sure to specify that this class contains polygonal features.
Tip: Try using WGS84 as your projection here as it will be the default in SAS Visual Analytics.
Once created, this new feature class is added to your list of layers automatically.
Tip: At this point we don't need the basemap anymore, so you can remove or hide this layer to improve rendering performance.
With the feature class layer selected, add a new toolbar named "Editor" and select "start editing." While in edit mode we can add new polygons. Select the "create features" icon and select "Polygon" as construction tool.
![]()
We are now going to create one polygon for each of the rooms. Creating a polygon is simply done by selecting a point for each corner of the room. Double click on the last point to finish a polygon.
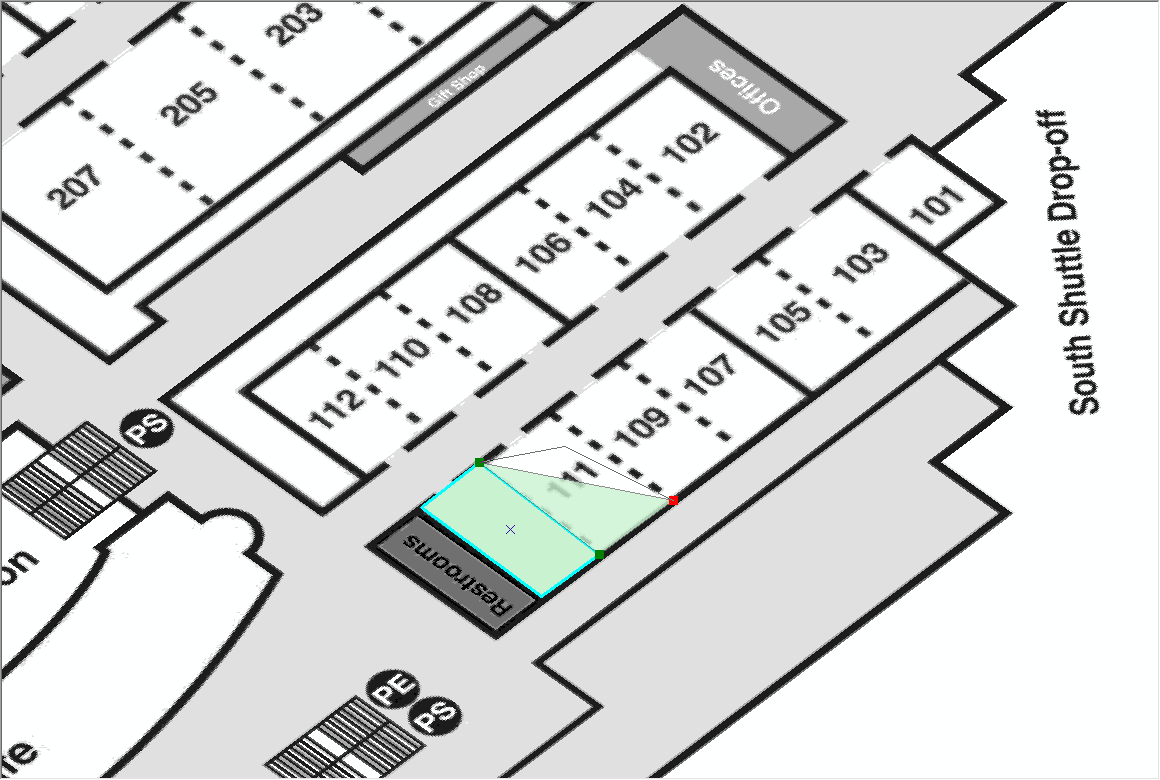
Creating polygons is surprisingly quick and the auto-snap feature helps to keep polygons aligned. Repeat the steps for each room and you will have a polygonal layer representing all rooms in no time:
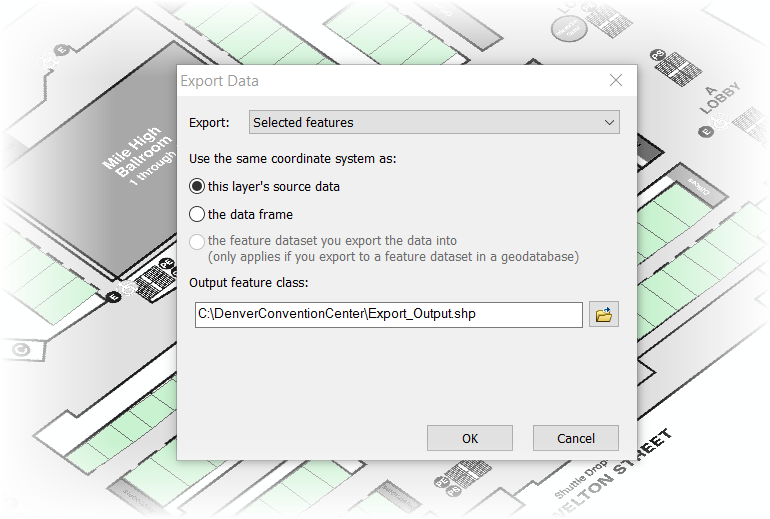
Save your edits to the layer. The final step is simply to export this layer as Esri shape file (.shp) so we can import the polygons into SAS Visual Analytics. Right click on the feature layer and select Data -> Export Data.
Tip: For easier reference in VA - you may want to also add additional attributes to each polygon such as the unique room id. This way you can register and reference each room using its room ID.
Importing polygon data
Now, that polygon data is available representing each room in our floor plan of the meeting center level of the Colorado Convention Center, we are going to import the given shape file into SAS Visual Analytics.
The import of Esri shape files is documented in the SAS VA Administrators guide and involves the execution of related macro %SHPIMPRT. The resulting table will be persisted using SAS Cloud Analytical Services (CAS).
Polygon provider registration
If this is your first time using a new polygonal data source, it will need to be registered. As a VA Esri Administrator ,you will have related options in the VA geographical editor to register such polygonal providers. The VA user guide has all the details. It will require you to map the shape file columns given their role, e.g. x/y coordinates.
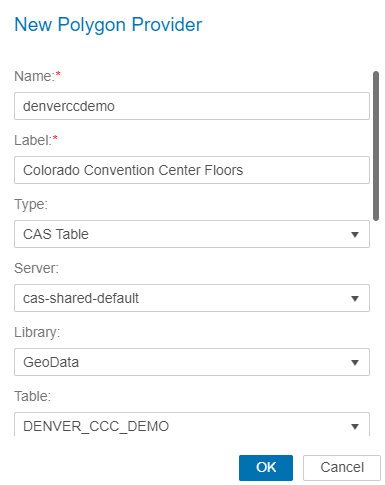
Saving the provider will make this custom polygon data available to all report creators.
Visualizing your data on the map
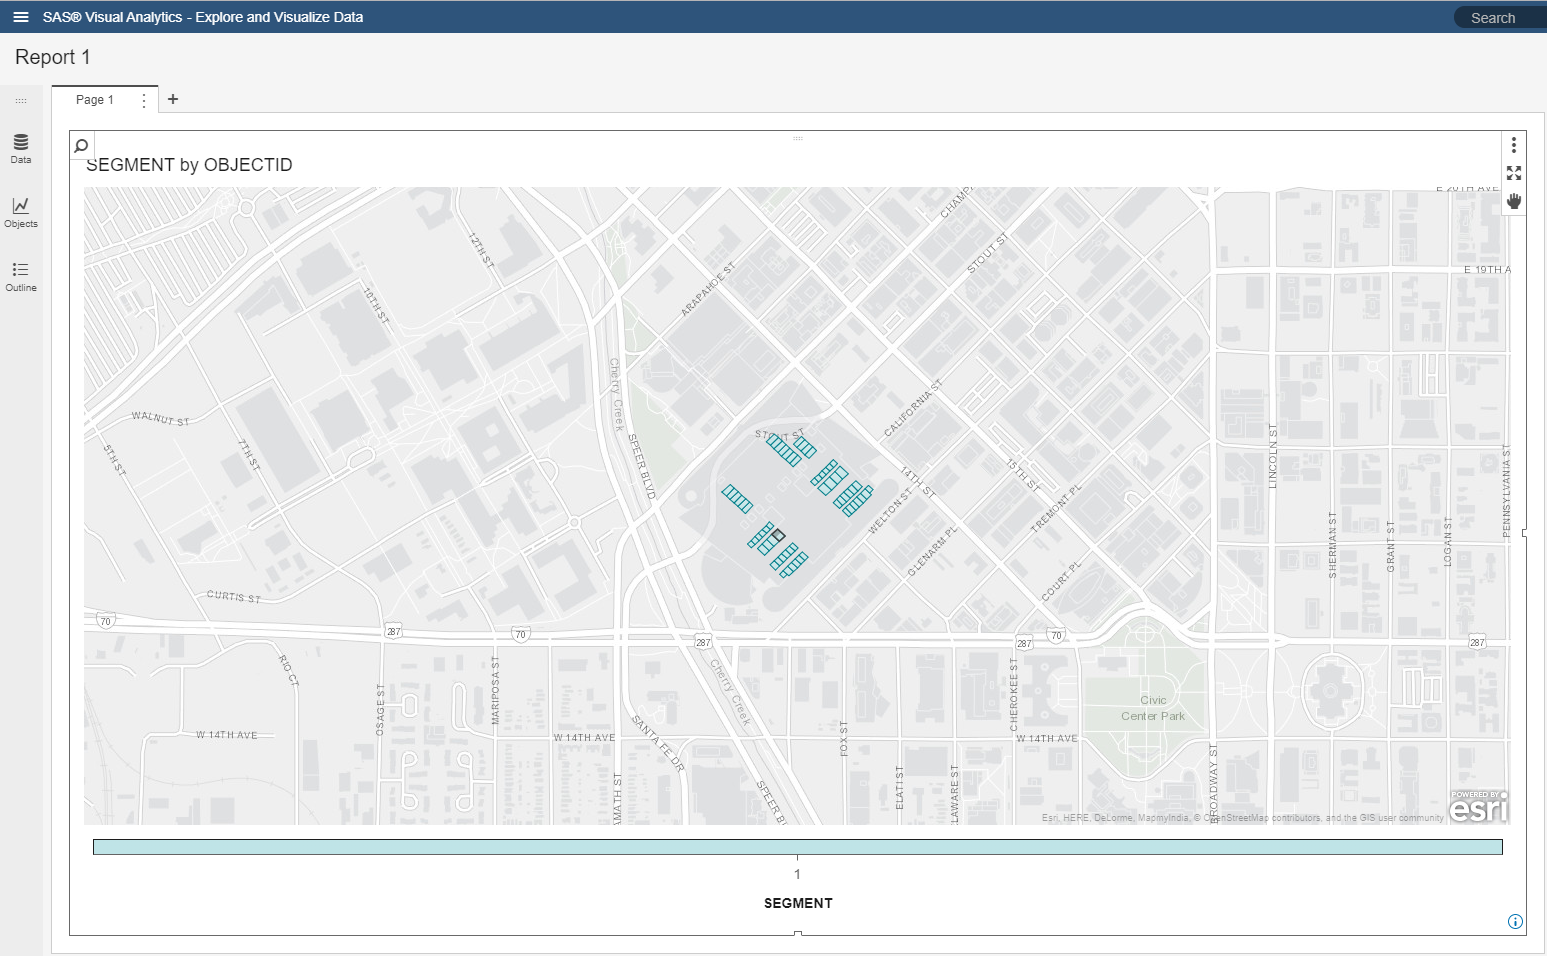
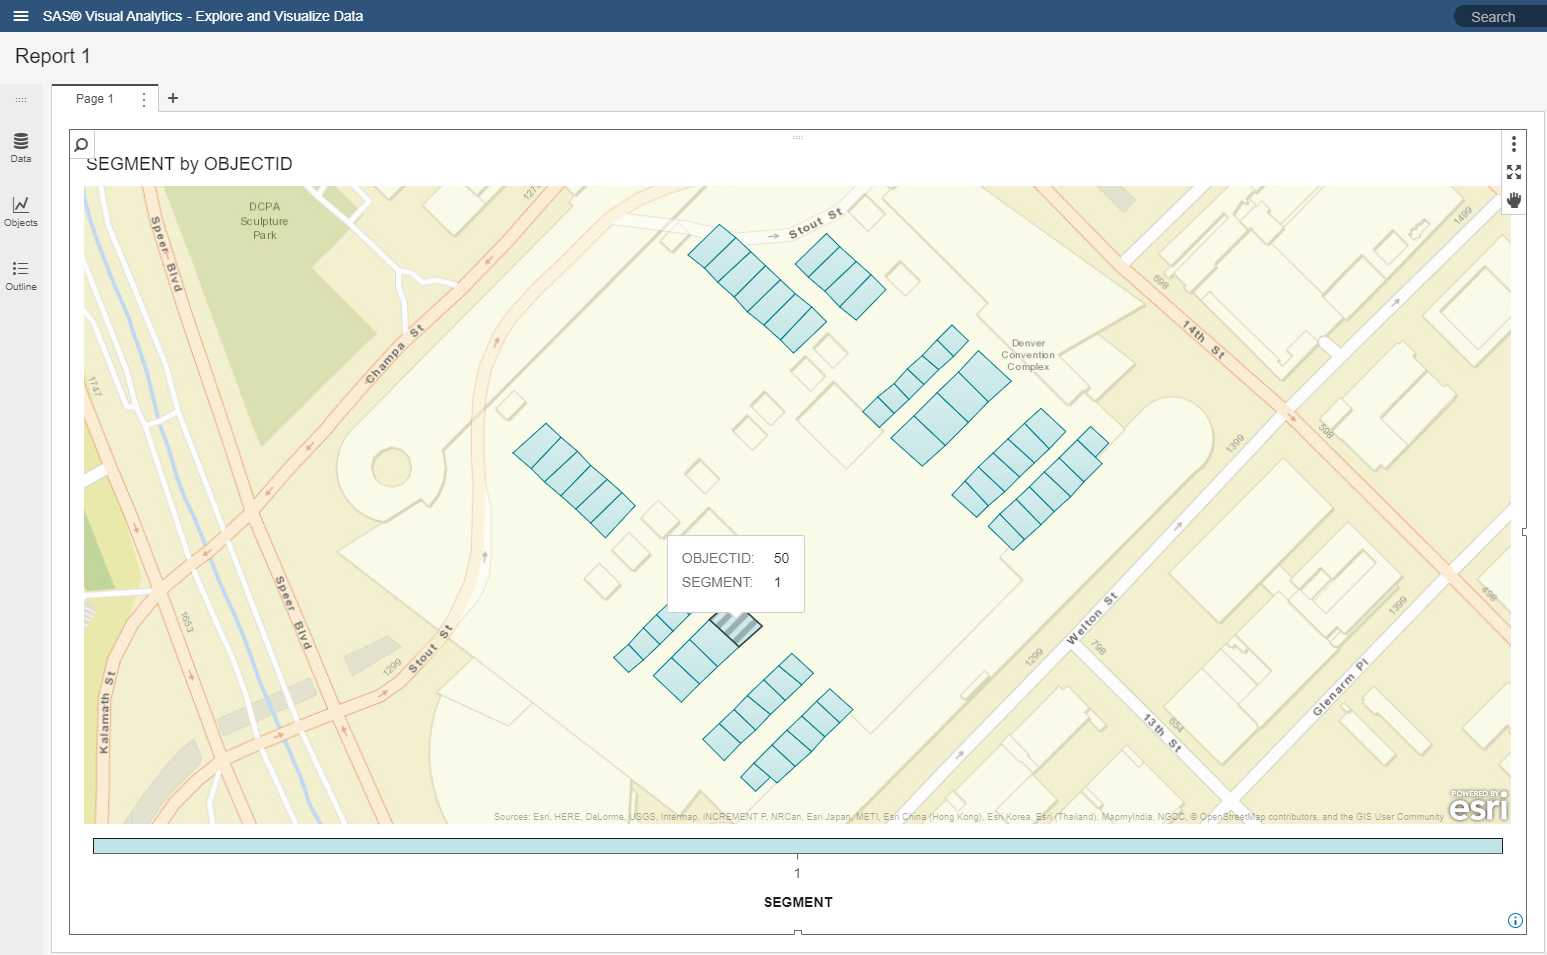
Once registered, you can define a new geographical item in VA using this new polygon provider. Given your data source has the correct mapping, each polygon should be rendered as expected on the map. For demonstration purposes my data source is also the polygon data set. More commonly, you would have data referencing rooms by their ID and contain more descriptive information such as room name, capacity, size, etc.
Given this is a very detailed floor plan, an alternative street map background will provide better details:
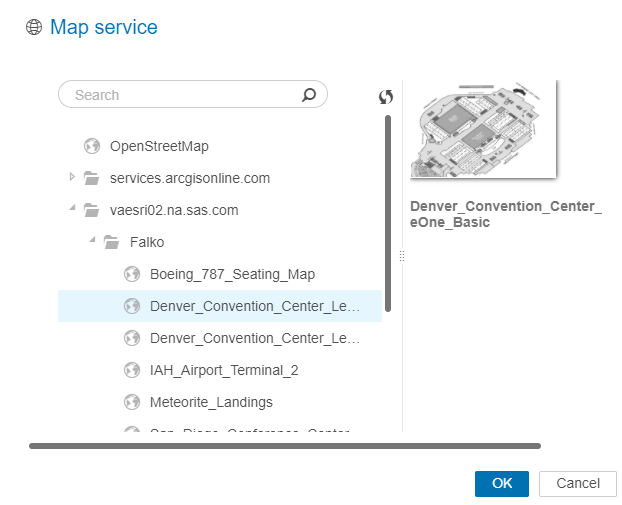
If you have registered our original floor plan image as a map service using an on-premise Esri server as mentioned above, you may also be able to select this as your map background instead:
This map is providing even more details:
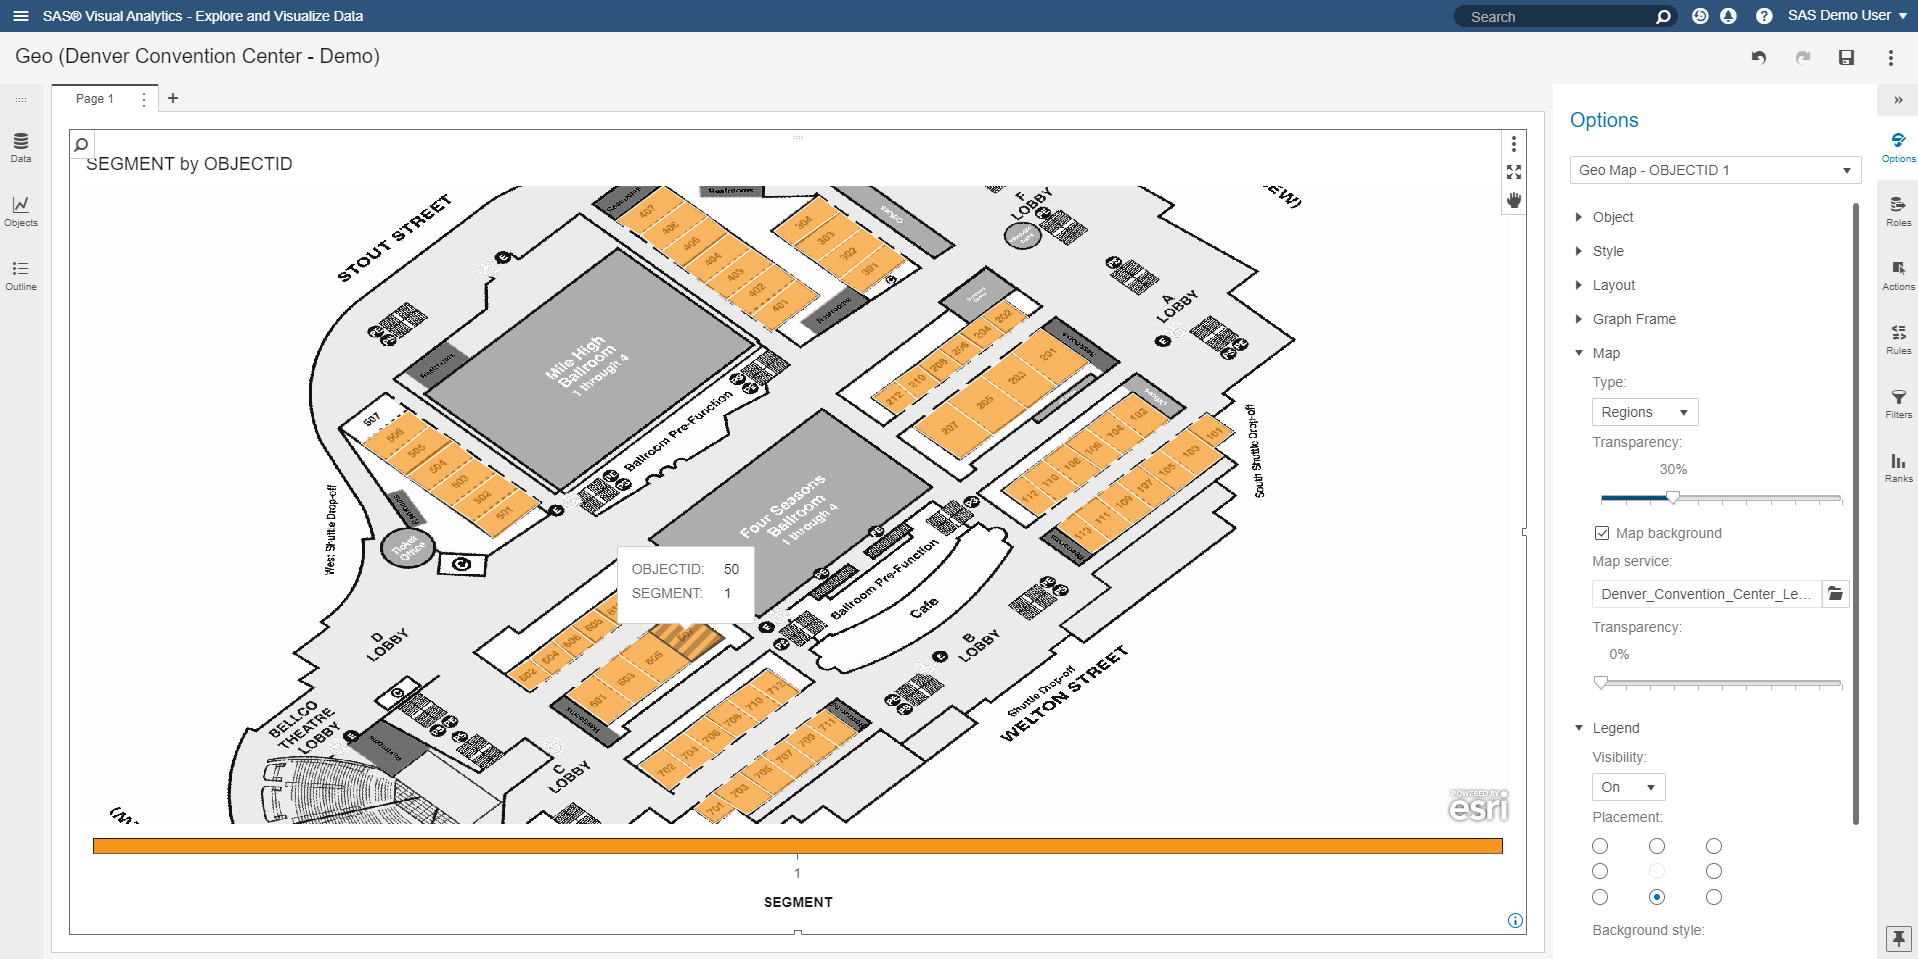
With such a detailed floor plan now being an interactive part of your report, you can create additional visualizations to interact with this geographical map. Dependent on your source data and related room metadata, you may color rooms given its capacity or category or use additional data tips to describe each room.
Conclusion
While getting access to detailed polygonal shapes can be challenging, you get rewarded with detailed geographical maps providing a lot more context and details than standard reference maps. This example described how to create polygon data from scratch, answering a common request from customers.
Often you will have polygon data available as its either public available (e.g. boundaries of well known areas such as US counties) or your organisation has related data prepared. With the recent release of SAS Visual Analytics 8.2, you can now import and render such polygon data with minimum effort. From simple sales regions, police districts to more detailed campus or floor maps - there are many use cases for utilizing regional overlays in SAS Visual Analytics.

2 Comments
Thanks for the in-depth article.
Great walkthrough example, Falko!