Are you struggling to kick start your organization’s analytics journey, especially when it comes to leveraging advanced analytics and machine learning techniques? If the answer is yes then you’re definitely not alone.
Whilst most organisations today recognise the benefit of analytics and data science, many are still struggling to kick start their analytics journey. Advanced data scientists are in short supply, and a largely siloed approach to analytics using multiple tools has prevented a more collaborative approach to analytics.
What if you had a way to empower business analyst and citizen data scientists? What if you had a way to quickly test and explore variables, uncover correlation relationships and prototype predictive models using a drag and drop, GUI-driven approach to analytics?
SAS® Visual Analytics, along with the add-on SAS® Visual Statistics module, offers users a powerful visual oriented tool that supports data exploration and visual modeling in a collaborative environment. Keep reading to learn how you can kick start your analytics journey with SAS Visual Analytics.
1) No coding needed
There will always a role for a programmatic approach to analytics and machine learning. Advanced analytics programming options provide tremendous power and flexibility for developing robust and complex machine learning applications.
But business analysts often prefer a more agile, visual oriented approach to data exploration and self-service analytics. When you can visualise complex relationships and generate predictive models without coding, you can empower analysts and kick-start the predictive modelling efforts of statisticians and data scientists.
You don’t have to be an advanced programmer, and you also don’t need to be a visualisation expert. You can use auto-charting to automatically select the best way to visualise the data using a combination of factors. Whether it be a basic bar chart, or an advanced correlation matrix, SAS Visual Analytics encourages experimentation and an exploratory mind-set by providing a code-less and friction-less analytics platform.
2) Data preparation baked in
Data and data preparation have always been a fundamental part of any analytical process. Having an integrated, self-service oriented, data preparation facility can not only speed up the overall analytics process, it will can also often lead to more accurate models and more powerful insights.
Whether you’re working with a simple text file on the desktop or large tables from a multi-nodes Hadoop environment, the latest iteration of SAS Visual Analytics makes it easy to import data from multiple sources regardless of
By having an intuitive, integrated data preparation module built-in, analysts can accelerate the complex process of preparing data for descriptive or predictive modelling which typically takes up 80 percent of the time and effort. Did I mention this is all done without ever having to write a single line of code?
3) Tackle the hard questions
In an increasing competitive world, business and analysts are relying more on data and analytics to answer more complex questions and make more business-critical decisions.
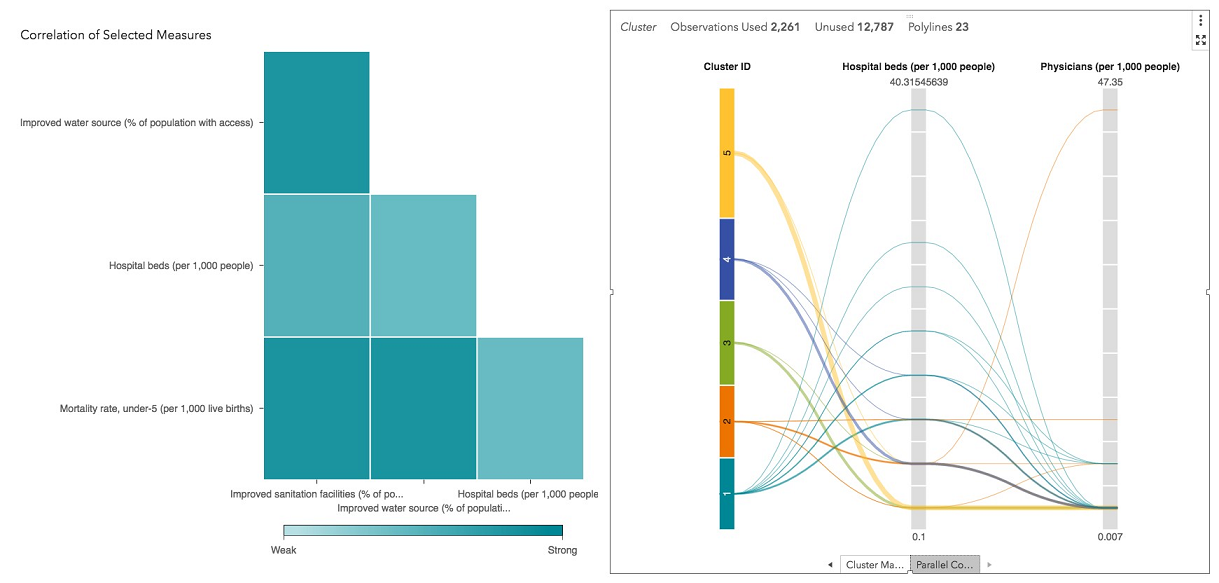
Advanced machine learning algorithms, not available in standard BI tools, can help you tackle the hard questions. SAS Visual Analytics and SAS Visual Statistics include the following visualization objects out of the box:
- Correlation Analysis (Pearson correlation coefficient based).
- Forecasting (Smoothing and ARIMA models).
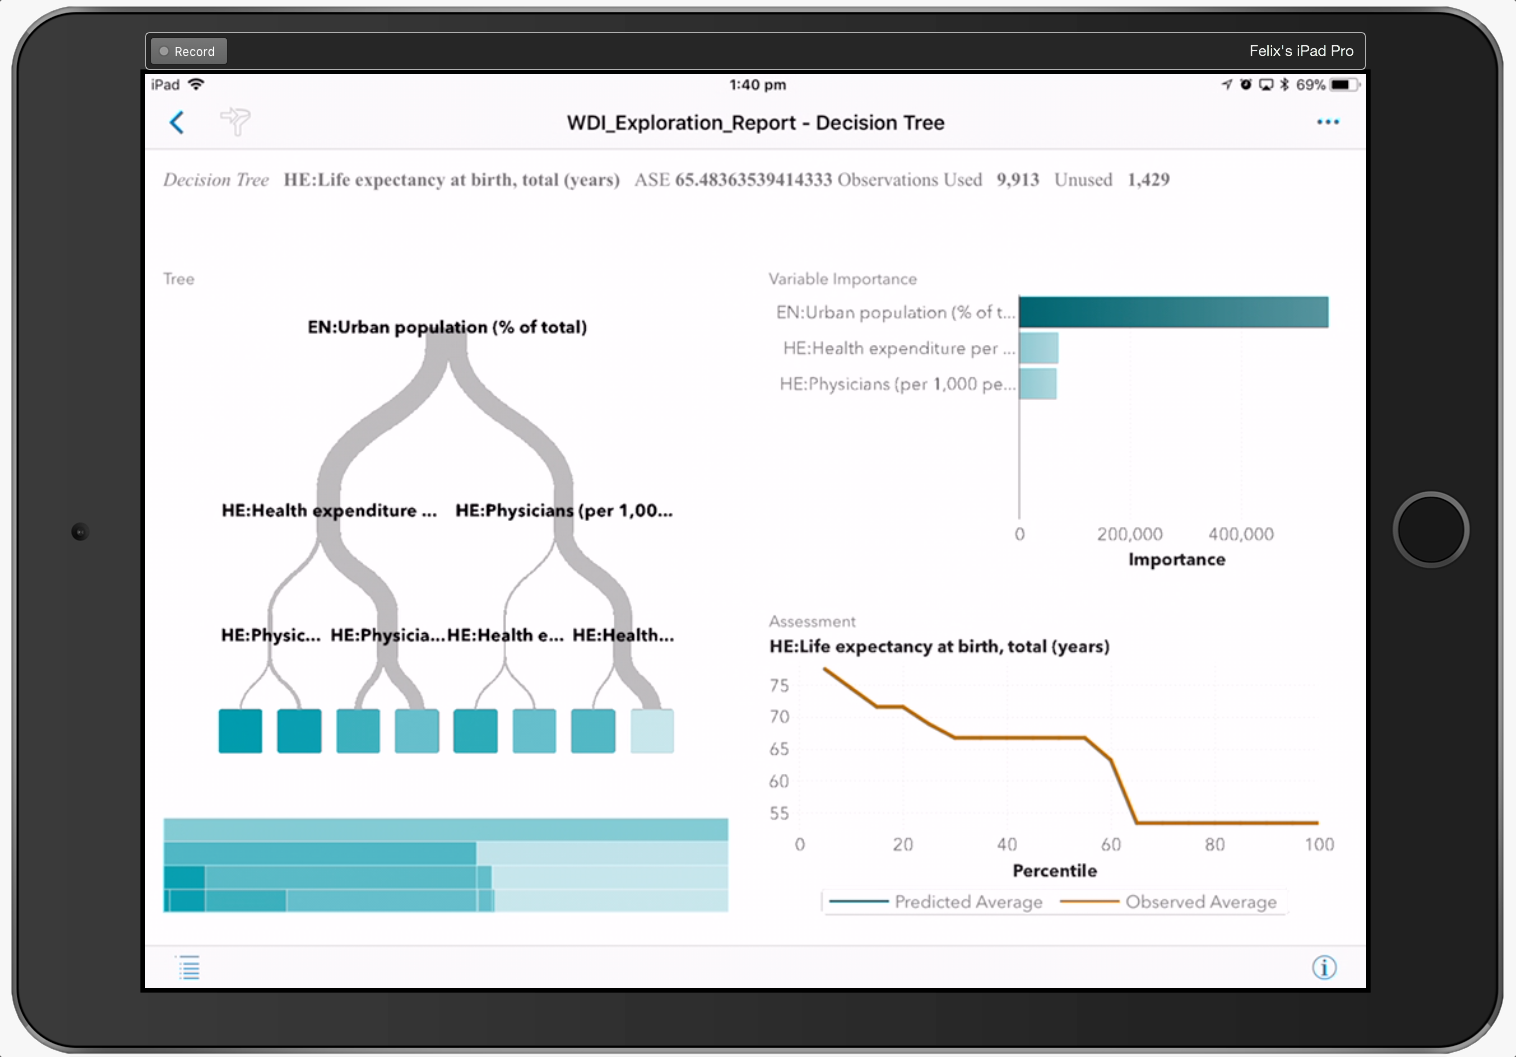
- Predictive models (Decision Tree, Linear Regression, Logistic Regression, Generalized Linear Model; Generalized Additive Model, Non-parametric logistic regression).
- Segmentation (K-Means based Clustering).
These advanced analytics techniques are integrated into the visual framework to allow you to create, customise and capture relevant insights using these advanced techniques.
At the end of the day, what it really means is that you can ask more complex questions. In addition to finding out more about what happened in the past, you can also understand why it happened and what is likely to happen in the future.
4) Share and show off your work
Analytics is a team sport, and collaboration is key part of any analytics endeavour. More importantly, being able to share and demonstrate the value of your analysis is key to ongoing support and funding.
Besides generating descriptive and predictive models, you also need a comprehensive and integrated reporting platform in order to share your valuable insights.
Any exploration or models created using SAS Visual Analytics and Visual Statistics can be easily shared with just a few simple mouse clicks. The results can be published and shared via the web browser or via mobile devices and Microsoft Office applications such as PowerPoint and Excel.
SAS Visual Analytics extends the self-service paradigm into the realm of self-service analytics. By supporting the needs of both business analysts and citizen data scientists in a single, integrated analytics solution, we believe we will not only help kick start the analytics journey but also accelerate the path to business outcomes and value.
How can you kick start the analytics process and accelerate the path to business outcomes and value? Experience these powerful features for yourself by heading to www.sas.com and signing up for a trial of SAS Visual Analytics and SAS Visual Statistics today.