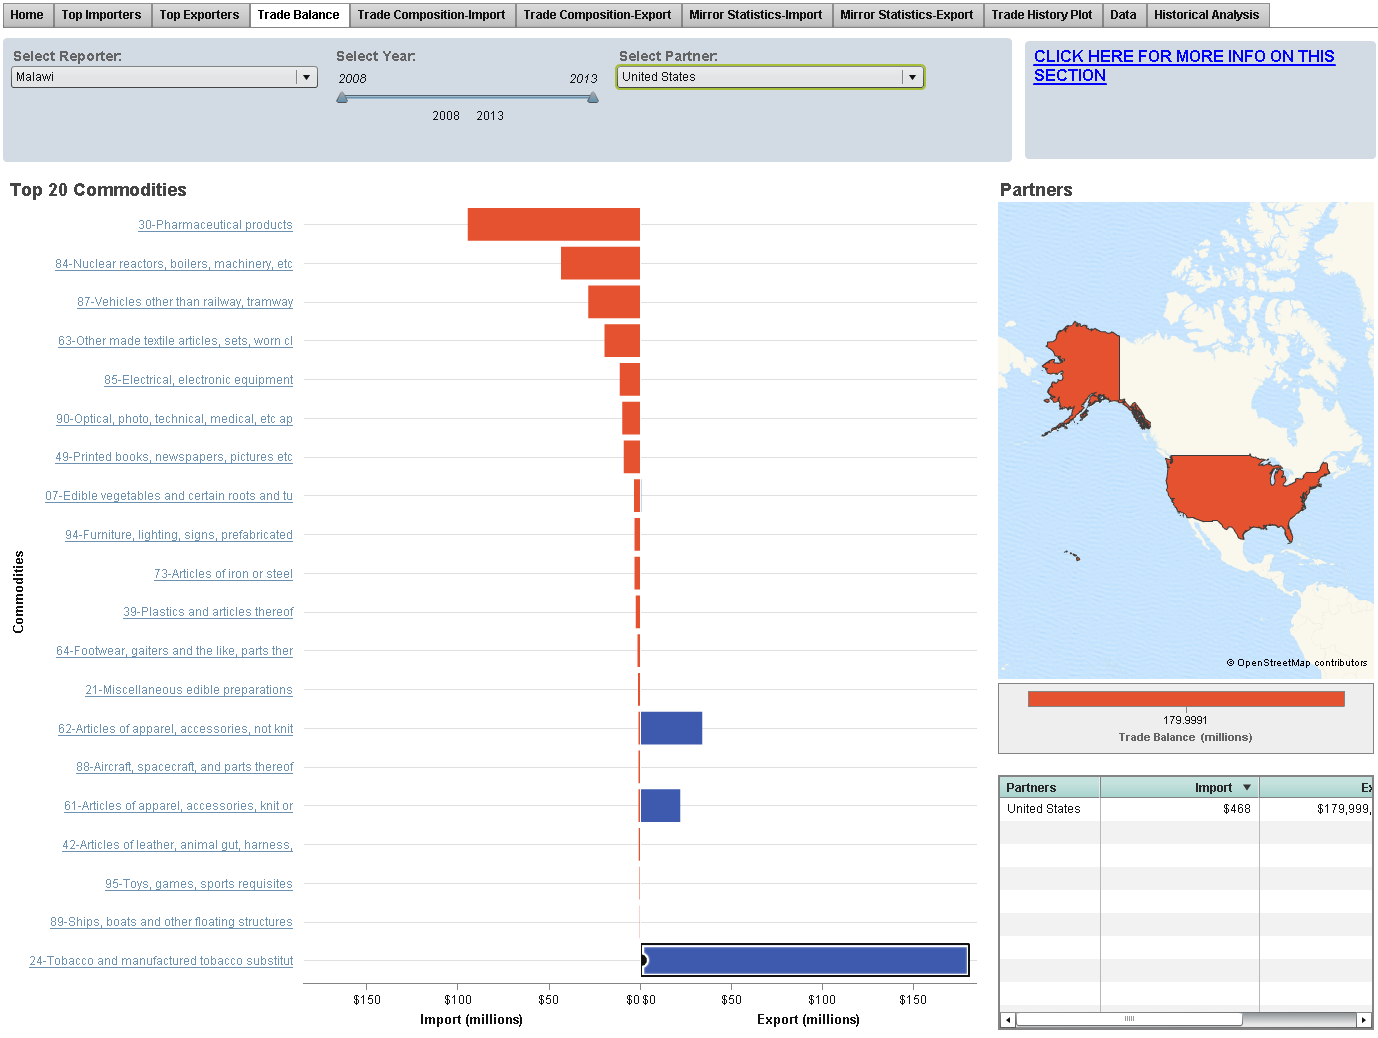
Did you know the US-Malawi trade relationship is based almost entirely on tobacco? Or that apparel & accessories drive Morocco & Tunisia exports while their North African neighbors rely on oil?
The United Nations Statistics Division collects detailed international trade data from more than 200 countries on the import and export of hundreds of commodities. Talk about Big Data... Until now, the UN Comtrade database has been too large for most people or organizations to consume and analyze in its entirety. Thanks to a new collaboration with SAS, the data is now available to everyone, via a web browser or mobile tablet, and unlocks valuable information that benefits policy makers, businesses, researchers and the general public. A few of the many possible use cases include:
- A trade minister can interrogate decades of international trade data on a mobile tablet.
- A global business can access immediate insights on risks and business performance in local markets
- A university student can gain the valuable experience of mining millions of rows of data for hidden trends and stories
SAS Visual Analytics for UN Comtrade brings Big Data to the masses, enabling anyone to glean insights from the most comprehensive collection of international trade data in the world...300+ million rows. Employing high performance data visualization, big data and cloud computing technologies, this online service exposes stories hidden across hundreds of trading partners and thousands of commodities to reveal how nations have interacted economically through the last three decades.
What stories can you uncover? How much oil does your country import? How much oil do your trade partners say they export to you? Is there a disparity? The mirror statistics raise plenty of questions.
Users can explore the date through several views, including:
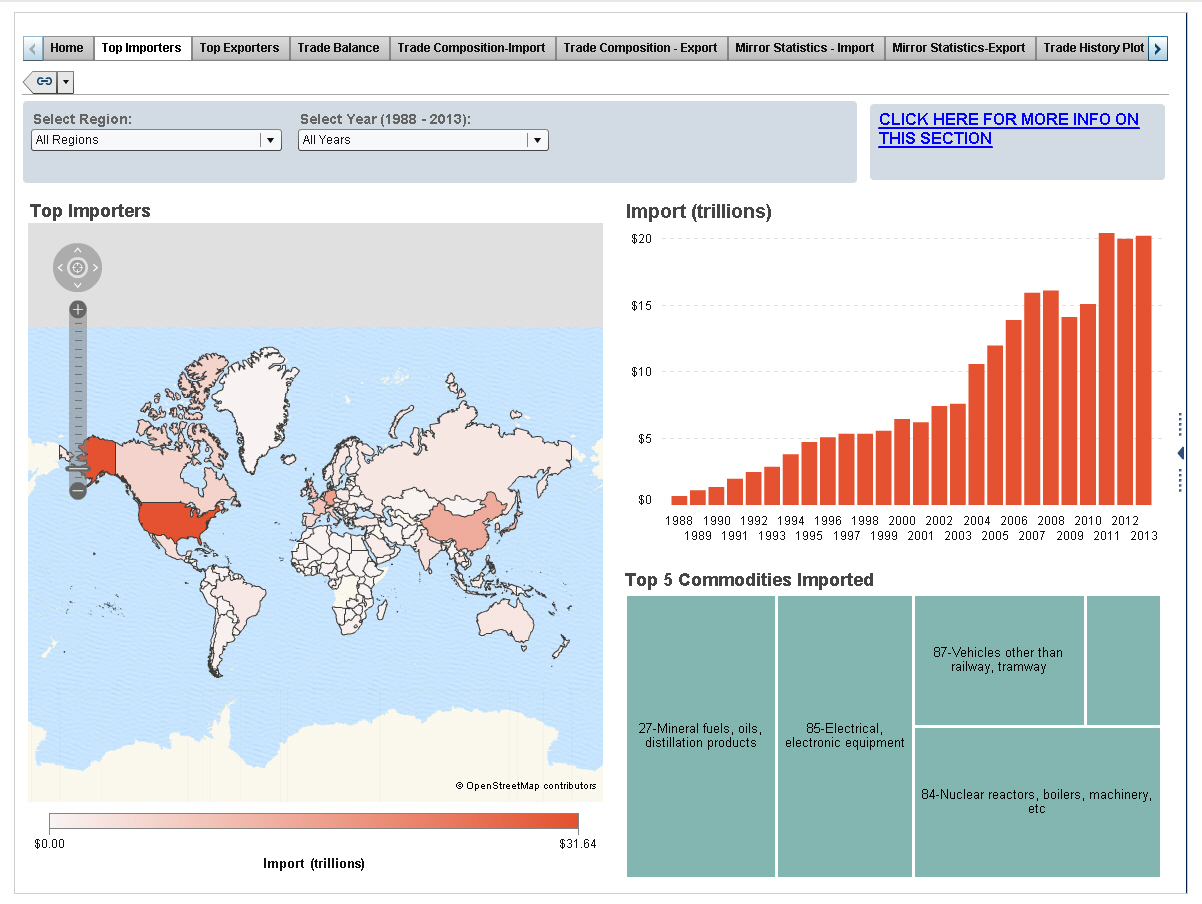
- Imports/exports: Top importers and exporters by world, region and country, and what commodities they trade.
- Trade balance: Top commodities bought and sold on a global or country level.
- Trade composition: Most frequently traded commodities by partners.
- Mirror statistics: A comparison of import/export data, as reported by partners on both sides of a trade relationship.
- Trade history: Top trading partners for any given country, with an animated bubble plot tracking relationships over the time.
- Data: All data, presented in tabular format with powerful filters
- Historical analysis: See trade history across any combination of partner(s), commodities and year(s)
SAS offers many of these unparalleled interactive visualizations for free at the link above. It is our contribution in advancing the global data revolution. We’re not just making the data public, we’re making the insights public – for the good of society.
In my next blog post, I will share lessons learned from this journey with the UN to help with their Big Data visualization initiatives.
What can you learn from the data? What surprised you? Please share your insights!

4 Comments
Real-time analysis of Big Data is available on Apple and Android tablets! Just download it and look for a data set called "United Nations" http://www.sas.com/reg/offer/sas/sas-mobile-bi
This real-time analysis of big data is also available on mobile tablets! Download the "SAS Mobile BI" app from the app store and look for a data set called "United Nations" http://www.sas.com/reg/offer/sas/sas-mobile-bi
View Part 2 of this blog: "Big Data Lessons Learned from 27 Years of Trade Data"
http://blogs.sas.com/content/sascom/?s=comtrade
Thank for posting such an informative article.