Over the years, in all my roles within SAS, I've been asked by customers, friends, family and all sorts of people, "What does SAS do?" Bottom-line: SAS delivers results across the organization, because that is what it was designed to do.
Specifically, SAS was designed to deliver analytic results, which ultimately provide two main benefits to any organization:
- To be more efficient (or grow revenue).
- To reduce waste (or cut costs).
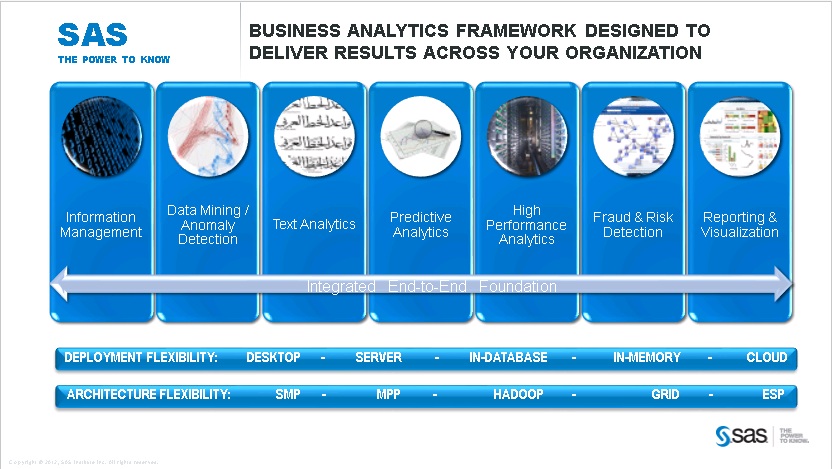
This helps explain why SAS has been so successful for 37+ years and why SAS is a great place to work. Who doesn’t like helping others succeed? Just like SAS Visual Analytics provides great insight through visuals, I've crated the following picture to show how SAS delivers results across the organization.
The ultimate business value of advanced analytics is the ability to put analytics results to use in a business setting by predicting what is likely happen in the future. If your data scientist develops a “great analytical insight” but it does not get delivered to your organization’s operational systems in a timely manner and in a format that decision makers can easily understand, that insight does no one any good.
What does a great analytical insight look like? It depends on who you are and what your perspective is. If you are a data scientist, the results could take on many different forms, including
- A lift chart that shows how good a predictive model behaves
- Various graphs that decomposes seasonality and other factors out of a forecast
- The optimal use of limited resources shown on a network diagram.
What if you are not a data scientist? How should this great analytical insight look to others throughout the organization? It should look like a robust report that wows the end-user. It may even look like similar operational reports but will contain forward-looking information that shows not only the current state of what has happened but also what will happen and even when it will happen.
If you're looking for a consistent way of developing analytics and delivering this type of valuable insight across all parts of an organization, consider SAS Business Analytics.

4 Comments
Great article and overview diagram of the SAS Business Analytics Framework!
It highlights SAS' proven strength in analytics and how SAS can also be used right across the enterprise by all types of users. A fantastic blog post that helps to answer the question "What does SAS do?"
Look forward to sharing. Thanks!
Michelle,
I am very happy you find the the information in the blog to be useful, thank you for reading and for your positive feedback.
David
Nice. Relevant. Been saying those 2 things for 13 years myself. Now I just add the little bit about how we have made it easy for the non-technical, business side of the house to be self sufficient without a lot of IT needed. Good stuff, David.
Laurel,
Thank you for reading and providing feedback (especially the positive kind).
It is always a pleasure working with you.
David