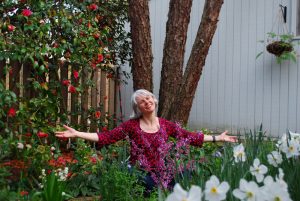
Annie Dudley Zangi was applying statistical methods to her science projects in primary school before she even knew about statistics. It just came naturally to her, and so did the experiments she conducted at her father's strawberry farm before she learned about split-plot designs. Read this full profile to learn how Dudley Zangi's interest in science and experimentation helped guide her into a career in statistics. And be sure to check out the rest of the SAS loves stats series as we focus on the International Year of Statistics.
What do you do at SAS?
I’m a research statistician developer. I write the code to make the Control Chart Builder platform in JMP work.
What’s your educational background?
Though both my undergrad and master’s degrees are in statistics, it’s the courses I took for a minor in computer science that helped me bridge the statistics knowledge into programming. My first job out of school was working in the Animal Genetics department as a statistician at my alma mater, Virginia Tech.
How do you use statistics in your job?
Part of my job involves researching both new statistical methods and requested published methods. However, focusing on how the engineer or scientist might need to solve a problem is the most interesting and challenging aspect of my job. I prefer to start implementing a new feature from the users’ perspective by designing a straightforward interface with their needs in mind, then figuring out how to solve it in the output statistically and graphically.
What about statistics appeals to you?
I love that with a little math or sometimes more, you can form quite accurate estimations and predictions on nearly anything. Before I learned formal statistical methods, I was using statistics as a kid trying to understand how to improve science projects. I learned much later I was running classic randomized complete block designs and split-plot designs.
After college, when working with animal geneticists, I learned you can make reasonable predictions I never would have thought possible, including calf birth weight, how many lambs will be born to a particular ewe, and the increase in rate of weight gain in a calf when his mother is given rBGH. For me, using statistics is like wearing eyeglasses; it clarifies so much of the world around us.
Can you comment on the importance of statistics in education?
I regularly meet kids and adults who are mystified by both everyday problems and the consequences of various actions. When I help them find answers for these problems by applying statistics, they often remark how easy and clear it is now.
Personally, I wish I had studied statistics in primary school. While I later learned I was running sound experimental designs, I was sometimes not analyzing them efficiently or correctly. If I had the right tools, I think I would have made it much further in the science. I think it’s important for everyone to have a statistical education sufficient enough to be able to apply it as easily as they would math or reading.
What advice would you give to students studying statistics today?
- Statistics will help you throughout your life and career, often in ways you won’t expect.
- Periodically, try to think of a scenario in your own life where each specific statistical topic would apply; this is what made it stick for me.
- You’ll have an advantage, since the US Bureau of Labor is predicting employment of statisticians to increase by 14 percent over the next 10 years.
Do you have a funny or interesting story to share about statistics?
When I was in high school, before I had any statistics classes, my father bought a farm and decided to plant a commercial strawberry patch. Not knowing which of the nearly 100 varieties of strawberries would do well, or which watering rate or method worked best, or the combination of these with plots near the creek or on a hill, I talked him into trying different combinations in a systematic, but randomized order. In my fourth year of college, I took a design of experiments class and learned we had used a classic split-plot design. As a result, I’ll probably never forget how a split-plot design works.
Do you have a favorite statistics blog or journal?
I quite enjoy reading the JMP Blog. Although I’ve been working with JMP the entire time I’ve been at SAS, I still learn new tricks and applications reading how someone else is using JMP.
Do you have a favorite statistician?
There are so many great statisticians; it’s hard for me to pick one. Today, William Sealy Gosset stands out, both because he contributed the t-distribution and tables for one of the most widely used statistics, the t-test, and because he did so anonymously under the name “Student.” It’s an interesting story to me that he developed this to help Guinness gain an advantage to make a better beer, and while he could publish the technique, he couldn’t associate either himself or the company with it. I am thankful he pushed to publish it, even though it wasn’t named after him.
Are there any other hobbies or interests you’d like to share?
I went through the master gardener program many years ago. I will probably always love gardening and still continue to run my little experiments to see which species and varieties grow better in different conditions.

1 Comment
Great interview and learning about Annie's interests and background. Love her view on the use of statistics "using statistics is like wearing eyeglasses; it clarifies so much of the world around us."