There are numerous algorithms used in forecasting, and each of those algorithms is optimized for a certain class of data. How does a business analyst know which forecasting algorithm to use?
With the new version of SAS Visual Analytics, you don’t have to know – the product does all the work for you by looking at your data, sorting through the most robust set of forecasting algorithms available, recommending the one that fits your data the best and providing a visual of the forecast immediately. This is Approachable Analytics at work for you.
For example, let’s look at sales revenue and material cost data from the Insight Toy Company. I see several trends in the data including a spike in sales revenue around the Christmas season. As a toy manufacturer, I need to budget and plan for 2013. SAS Visual Analytics Explorer allows me to quickly generate a forecast for both sales and material cost, something that will help me budget for 2013.
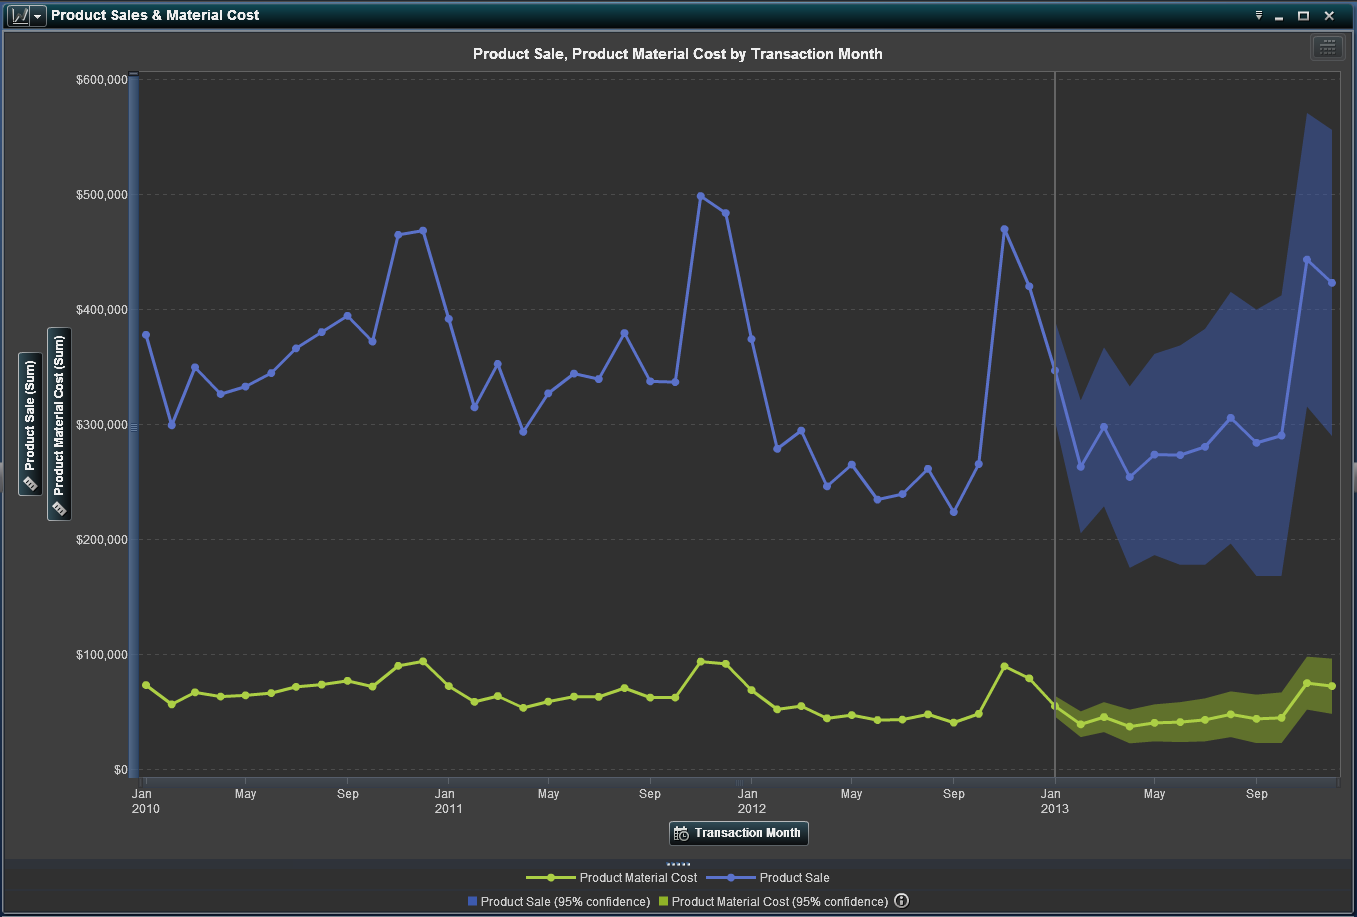
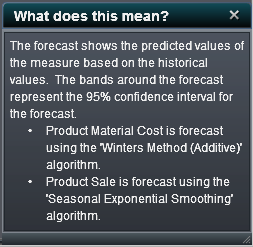
For every series that is forecasted, several algorithms are considered and the most appropriate one is automatically selected. In this forecast, two different algorithms were used: the Winters Method algorithm and the Seasonal Exponential Smoothing algorithm. I am able to access this information by selecting the information icon in the visualization legend.
Why, you might ask, did we add forecasting capabilities to the latest version of SAS Visual Analytics Explorer? Was it in order to analyze the accuracy of the fabled Mayan prediction about the end of the world on 12/21/2012? Indeed, if we had analyzed this complex problem and forecasted the expected world population in 2013, we would have looked at the data, gained some valuable insights, and predicted the world was not going to end. Oh yah, we nailed it!
All kidding aside, Predictive Analytics have always been a strength of SAS offerings and we wanted to get those capabilities into the hands of business analysts as quickly as possible. You do not have to take my word about what SAS is doing with predictive analytics. I encourage you to read The Forrester Wave™: Big Data Predictive Analytics Solutions, Q1 2013 report Forrester released earlier this month. Are we sitting back and celebrating this success? Celebrating, yes. Sitting back, no way.
I cannot wait to show you what is shipping in our next release; it is a nice addition to the forecasting capabilities I discussed in this posting. Until then, go see for yourself what SAS Visual Analytics is all about.
Take care,
Don

1 Comment
Keen to see what is coming in the next release... Are there plans for integration with SAS Forecast Studio and Time Series Studio?