Major European football (soccer) leagues came to an end after an intensive year. Manchester City claimed the Premier League title after a high-intensity title race against Liverpool. It is unbelievable that Liverpool would have won 25 out of the last 27 PL titles with 97 points. Luckily, the Reds deserved and won the Champions League, and redeemed themselves after losing last year's finale.
Football is over on the pitch for the season, but the battle for the transfer season is beginning now. Money shapes major football leagues all over the world despite rare successes by lower-budget teams such as Leicester City in 2016. Teams across Europe are changing the outcome of their domestic leagues with massive transfer budgets. Transfer season is the time when teams are shaping their potential for the next season for sure. Sports analytics is often used to analyze teams on the pitch, but it is possible to bring it to the transfer season also. We have a chance to analyze the upcoming transfer season using mathematical optimization and the capabilities of SAS Viya.
Analytics for Transfer Season
In football, players can move between clubs during the transfer season. If they are out of contract, clubs can acquire them and sign a contract. Otherwise, the current contract needs to be terminated before any transfer. In this case, the purchasing team pays an amount called the transfer fee.
"How should we allocate our transfer budget to maximize the benefit we gain?" This is the ultimate question that every team needs to answer. (Teams often try to answer "Which player should we get to make our fans happy?", but no one truly knows what could make fans happy.) Maximizing benefit under a limited resource is known as the Knapsack problem in combinatorial optimization. Given a set of items and their values, the Knapsack problem is to find the optimal selection of items to pack within a weight limit to maximize the total value. We can ask a similar question here: given a set of players, their values and ratings, how to choose which players to transfer to maximize total team rating within a budget limit.
Even though writing a detailed mathematical model of the problem is challenging, I will show how a simple model can be written to benefit from the capabilities of optimization. Before we dive any further, note that we are solving a simplified problem under the following assumptions to make things easier:
- We consider only the starting lineup to measure team ratings
- Teams can transfer any player as long as their current value is paid
- We only focus on acquiring players, not selling them
- Teams use the same formation for the next year
- Players can be played only at the positions they are listed in the data set
Data
One of the most challenging stages of any analytical problem is to obtain clean data. At this point, we are lucky to have a great web resource: sofifa.com. SoFIFA has more data than we need for this problem. By using parallel web requests, we managed to create a database of 12,000 players sorted by their overall rating. The web scraper is available on GitHub and the data are available as a CSV file.
As an important side note, since these models are being run on data based on the football game FIFA, not on real player metrics, they are a better reflection of the players in the computer game, not the players in real life. However, these same concepts can be applied to real player data if you have access to it.
Model
Our aim is to maximize the sum of player ratings in the starting lineup of teams. We will solve the problem separately for each team. For each position, we filter the list of players who have a better rating than what the team currently has. Then, the increase in the total rating is used to measure the performance of the transfer for the team.
Let us define as the set of all players,
as the set of team positions, and
as the set of player-position pairs. The following parameters are used to define the problem:
: Current rating of the player at position
: Overall rating of player
: Team budget
: Transfer value of player
The main decision variable represents a binary variable, whether player
is transferred for position
. We also have an auxiliary variable
to define the final rating for position
in the formation.
The objective function can be written as the summation of the final ratings:
Our first constraint is the budget for the transfer. The total value of players transferred cannot exceed the team budget:
The next constraint defines the final rating for each position. This constraint accounts for transfer player replacing the current player at position
:
The following two constraints satisfy conditions that at most one player is transferred for a given position, and the one player cannot be transferred for two different positions:
Python Model
We model this problem using sasoptpy, an open-source Python interface of SAS Optimization.
m = so.Model(name='optimal_team', session=session) rating = m.add_variables(POSITIONS, name='rating') transfer = m.add_variables(ELIG, name='transfer', vartype=so.BIN) m.set_objective( so.quick_sum(rating[j] for j in POSITIONS), name='total_rating', sense=so.MAX) m.add_constraint( so.quick_sum(transfer[i, j] * value[i] for (i, j) in ELIG) <= budget, name='budget_con') m.add_constraints(( rating[j] == overall[member[j]] + so.quick_sum( transfer[i, j] * (overall[i] - overall[member[j]]) for (i, j2) in ELIG if j==j2) for j in POSITIONS), name='transfer_con') m.add_constraints(( so.quick_sum(transfer[i, j] for (i2, j) in ELIG if i==i2) <= 1 for i in PLAYERS), name='only_one_position') m.add_constraints(( so.quick_sum(transfer[i, j] for (i, j2) in ELIG if j==j2) <= 1 for j in POSITIONS), name='only_one_transfer') m.solve() |
Notice that it is very easy to model this problem using the Python interface. Our open-source optimization modeling package sasoptpy uses the runOptmodel action under the hood, as shown in examples in the documentation. If you are familiar with PROC OPTMODEL, you can write the SAS code and run it on SAS Viya directly.
Results
We have run the optimal transfer problem for the top six teams in Premier League standings: Manchester City, Liverpool, Chelsea, Tottenham, Arsenal, Manchester United. The current team and budget information are obtained from SoFIFA at the time of execution. We filtered out all the players older than 33 years old since a majority of players reach their peak before 33 and steadily lose performance.
See the table below for a comparison between optimal transfers for each team. The positions of the transfers are given in the following figures below the table.
As mentioned above, we do not consider the likelihood of the transfer itself. We consider what money could buy if teams are able to get players at their current valuation.
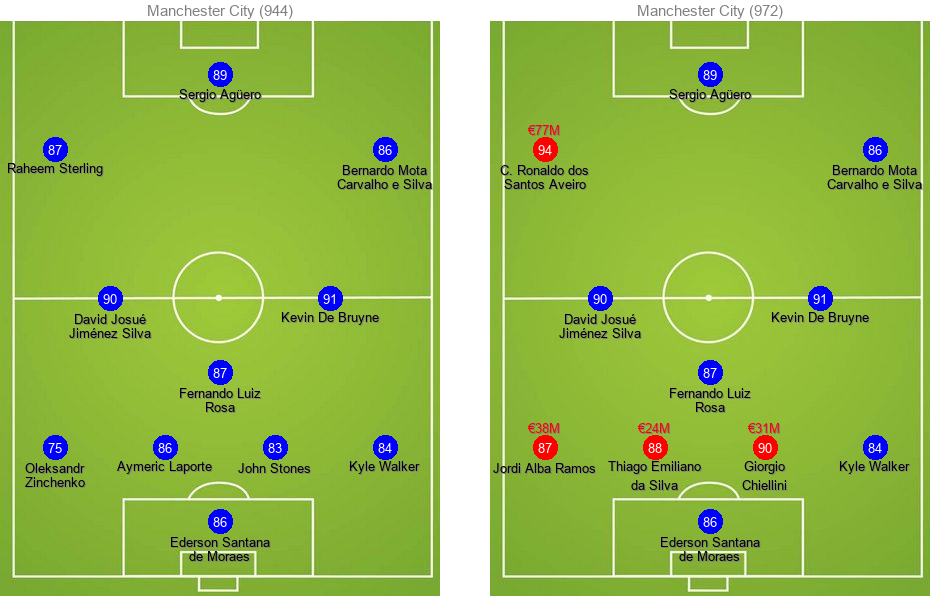
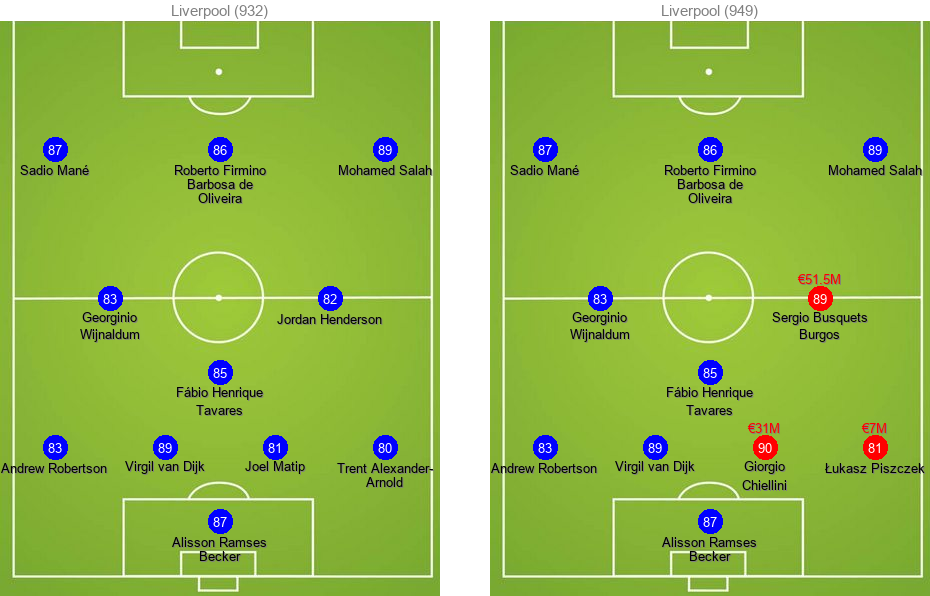
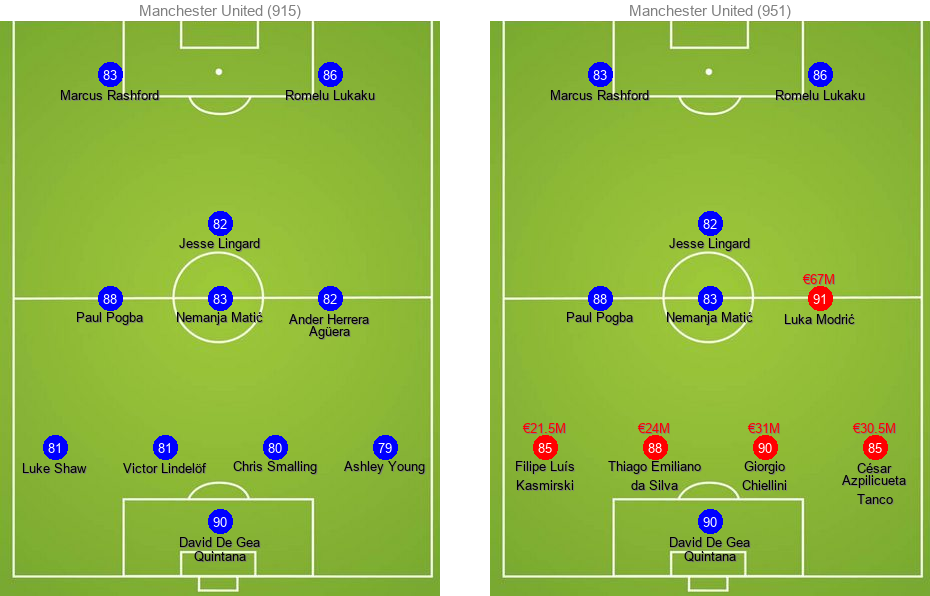
Manchester City increases its total team rating from 944 to 972 by 28 points if they spend all of their current transfer budget of €170M. It is not surprising to see that with a rather limited budget of €90M, Liverpool can increase its total rating by 17 points, whereas Manchester United's total team rating can increase 36 points with their massive budget of €175M.
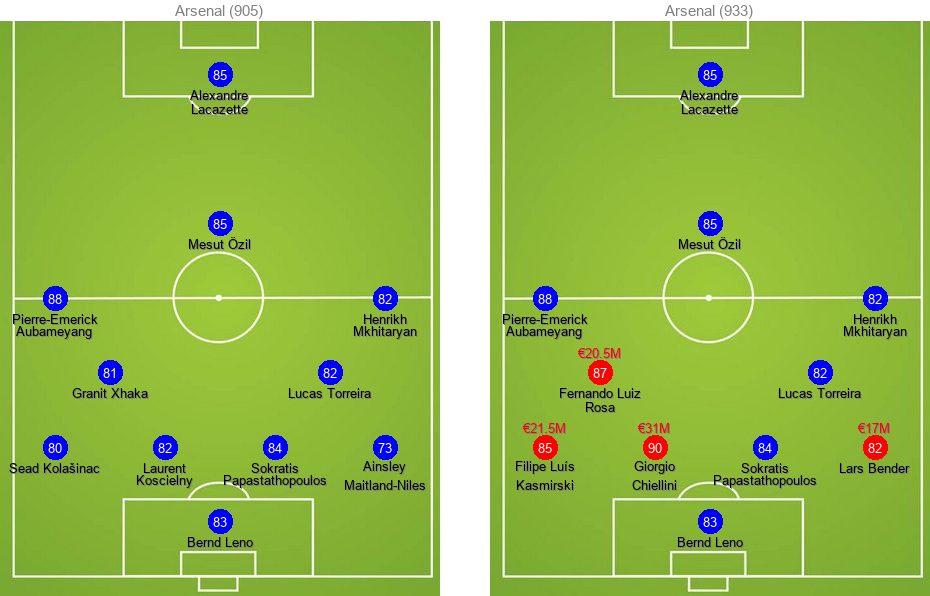
The efficiency column is calculated by dividing the change in total rating by total money spent in million euros. We expect the efficiency of the transfer to be larger when a few players have significantly lower ratings compared to the rest of the team and can be replaced with rather cheap alternatives. Arsenal has the highest efficiency and can increase its total rating 0.31 per million euros by purchasing 4 players.
The reason why the total rating of Liverpool does not increase as much as Arsenal's despite having close transfer budgets can be explained by the variation of the player ratings. The rating of the right back (RB) is increased 9 points (from 73 to 82) with a transfer worth of €17M for Arsenal. Liverpool's lowest rating in the current team is 80. Player values tend to increase sharply as we increase the rating:
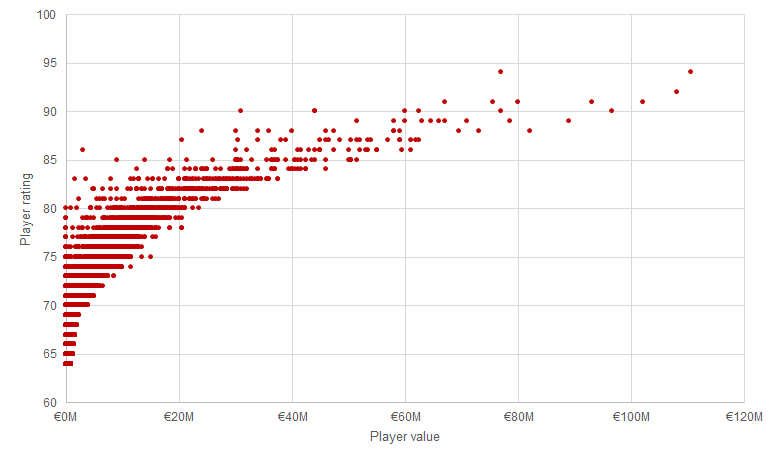
Therefore, it is clear why some teams have an advantage in the transfer season. For these teams, it is easy to improve the team by replacing the weakest player. Consider these two extremes: Manchester City has to spend €170M to improve its total rating by 28 points, whereas Arsenal increases its total rating the same amount by spending €90M only.
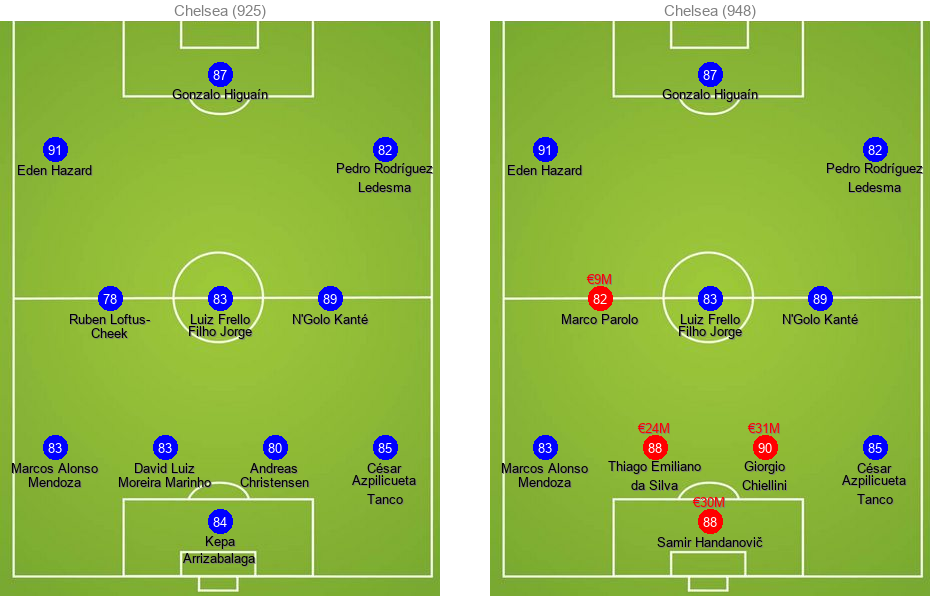
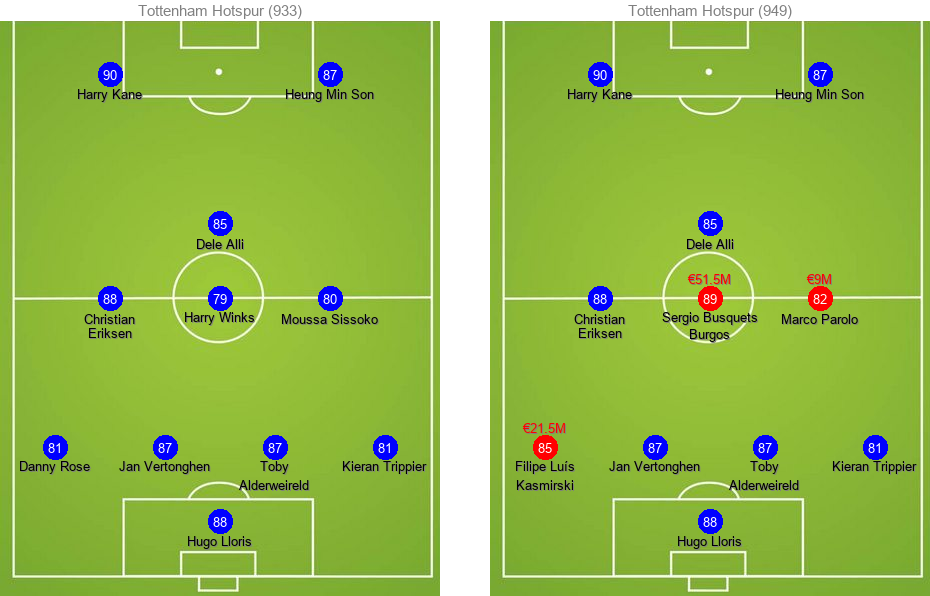
Here's how the old and new lineups look for each team. New transfers are colored red while existing players are in blue:
Budget Limitations
In the last problem, we will have a look at how the budget is affecting the decisions. We will be varying the transfer budget of Liverpool from €0 to €200M in increments of €10M to see how it affects the outcome.
As seen below in detail, efficiency (total rating increase per million euros) decreases as we pay more money for a relatively lower change, as expected.
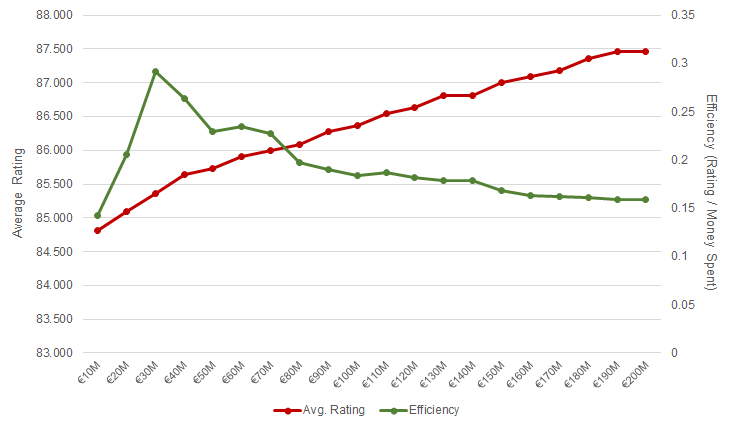
It seems Liverpool gets the best worth of its money if the Reds transfer Thiago Emiliano da Silva for CB position. Notice that efficiency converges to 0.16 total rating increase per million euros spent as we keep increasing the budget.
Increasing the potential
We have looked only at the current ratings of the players up to this point. The next problem we solve includes "potential" ratings of the new transfers. Naturally, young players have a significantly higher potential value compared to the old players. We need to replace the rating constraint as follows:
where is the potential rating of a player, and
is the potential of the current player at position
in the team.
For players under 25 years old, the optimal solution is to replace Henderson and Matip with Melo and de Ligt for €36M and €44M, respectively. These changes increase the potential rating by 18 points:
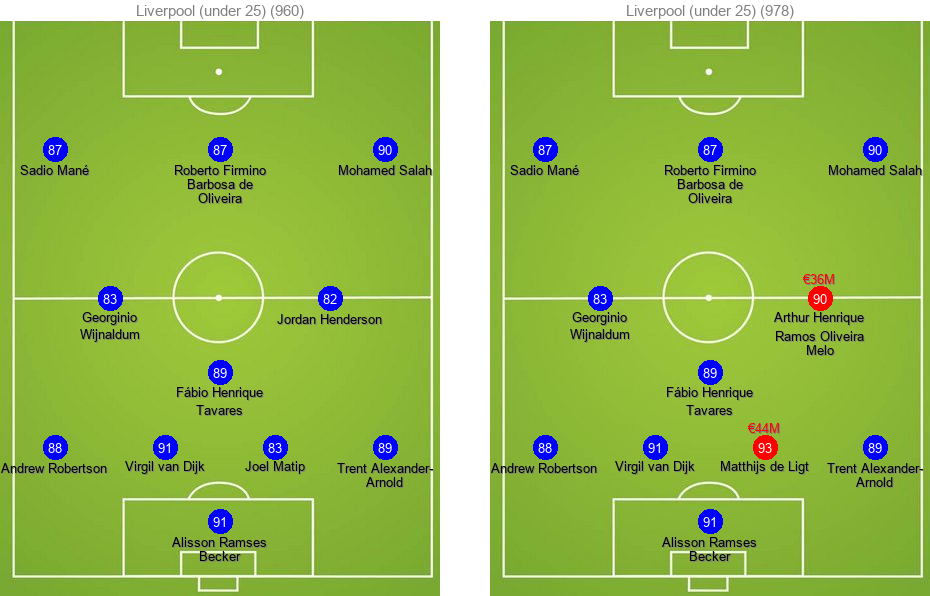
Edit: An earlier version of the blog post compared potential ratings of new transfers to current ratings of the current team. After fixing the problem, results have changed slightly.
Edit #2: We have updated results after fixing a filtering issue with the CSV database.
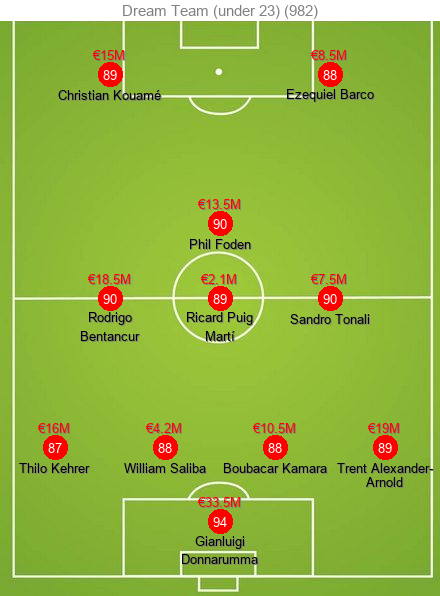
Dream Team under 23
Based on reader suggestions, we had a look at the optimal squad under €150M budget. Our objective is to maximize the potential rating and create a full team. I chose 4-4-2 formation for illustration purposes. The optimal squad cost €148.3M and the potential rating is 982:
I hope you enjoyed this brief analysis of potential transfers for top Premier League teams using Python and SAS Viya. I would be happy to answer if you have any questions, especially about how the model is constructed and how it is easily implemented in Python using sasoptpy. As usual, all the code for the problem is available at GitHub.