When I shared a status update a few months ago that I would spend my Sunday morning "trying to solve an asymmetric prize-collecting traveling salesman problem with uncertain data and side constraints" my colleagues knew that I wouldn't be working. Instead, I would spend my morning at an orienteering event, in particular, a score-O.
Orienteering
Orienteering is the sport of finding some physical control points in the woods as fast as possible using only a map and a compass. The standard competition is point-to-point, where all the controls need to be visited in a prescribed order. (There is a subtle optimization problem in there as well; you need to figure out how you will get to the next control, factor in topography, obstacles, trails, fatigue, and so on.) The competition I attended a few months ago was score-orienteering. We were given 25 control points, and we had to visit as many of them in a set time limit as possible. (I chose two hours, but there were one-hour and four-hour options as well.) Each control is worth a certain number of points, and the runner with the most points wins. You can see the locations and the point values of the controls in this figure:
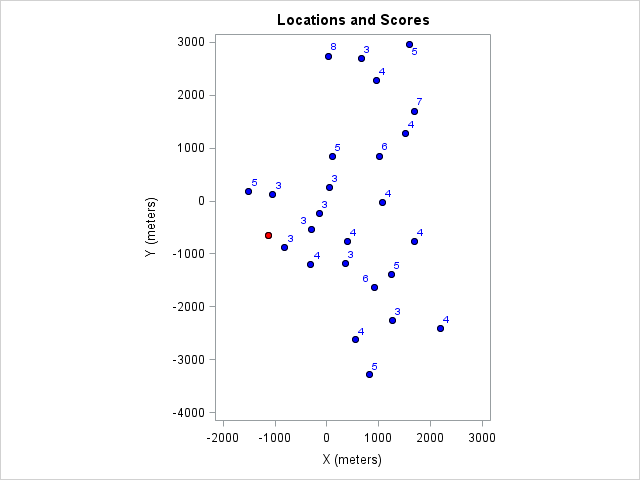
The race starts and ends at the control marked with the red dot.
There is a severe time penalty for not reaching the finish on time: 8 points for the first minute over the time limit and 1 point for each additional minute. There was also a special bonus for reaching both the East-West (6 points) or the North-South (8 points) controls.
We had about 30 minutes to plan our routes, but most of us also had to recalculate (read improvise) on the go.
So how does one (with a Ph.D. in optimization) go about solving a problem like this?
Use optimization to find your way in the woods! #orienteering #optimization @sassoftware @orienteeringusa Click To Tweet
The data
As usual, the most challenging aspect of this project is getting the data right. We need to get pairwise distances between the control points. This is easy to do on a map: just measure and multiply by the scaling factor. However, there are certain complications. First of all, in reality the distance will not be symmetric; that is, reaching point A from point B can be much faster than reaching B from A if B is at the top of a hill and A is in the valley. Another complication is that the distances are uncertain. Usually the controls cannot be seen from a distance; they need to be found. This adds to the time it takes to reach them. Also, the runner might make a mistake while navigating or stop for a water break. To make it worse, this uncertainty varies from runner to runner.
The ideal model (or knowing too much is dangerous)
An overly ambitious consultant might collect data from past races and come up with an approximation for the distribution of the travel times between control points (in both directions). Knowing that, the consultant could calculate the distribution of completion times for various course options and choose the best one according to some criterion:
- most points with at most a small chance of not finishing on time, or
- highest probability of success given the number of points targeted, or
- highest expected value of points finishing within the time limit (this assumes that the runner reoptimizes after each control).
Although such a detailed analysis would solve the problem completely, it isn't practical. This is usually the case not only for orienteering but for most practical engagements: the modeler needs to simplify the problem to make it practical and solvable.
An approximation
A usual orienteering course is characterized by its length and the number of controls it includes. I use a GPS tracker to see how much I actually run during a race and compare that to the ideal course length. The closer these two numbers are, the better I am at navigating or the easier the course is. In my case, at the time of this race, the ratio was around 1.5, so I figured I would end up running about 50% more than the ideal distance. (That wasn't very good, I've improved since.) I also knew my pace during these races: I could do an average speed of about 6km/h. So before the race I estimated I would run about 12 kilometers, and I could cover a course that is about 8 kilometers long.
This simplification assumes that the course for the score-O race is similar to the courses I've run before. Its power comes from the fact that it accumulates all the uncertainty into just two numbers: the average speed of the runner and the ratio between the ideal and the tracked distance.
Now we can take the ideal pairwise distances and use them in this adjusted setting.
The standard model
The optimization model is a variant of the traveling salesman problem (TSP). For simplicity of exposition, we use the MTZ formulation. We have a binary variable for each control point to indicate that the control is part of the route. Another set of binary variables indicate whether each arc is used.
set NODES; num x {NODES}; num y {NODES}; num score {NODES} init 0; read data &node_data nomiss into NODES=[control] x y score; str source; for {i in NODES: score[i] = 0} do; source = i; leave; end; set <str,str> ARCS; num distance {ARCS}; read data &arc_data into ARCS=[c1 c2] distance; /* declare decision variables */ var UseNode {NODES} binary; var UseArc {ARCS} binary; |
These two variables are naturally connected by the following constraints:
con LeaveNode {i in NODES}: sum {<(i),j> in ARCS} UseArc[i,j] = UseNode[i]; con EnterNode {i in NODES}: sum {<j,(i)> in ARCS} UseArc[j,i] = UseNode[i]; |
We need to make sure that the tour is contiguous; that is, it doesn't include a subtour. So we introduce an order variable:
var U {NODES} >= 0 <= card(NODES) - 1 integer; /* if UseArc[i,j] = 1 then U[i] + 1 <= U[j] */ /* strengthened by lifting coefficient on UseArc[j,i] */ con MTZ {<i,j> in ARCS: j ne source}: U[i] + 1 - U[j] <= (U[i].ub + 1 - U[j].lb) * (1 - UseArc[i,j]) - (card(NODES) - 2) * UseArc[j,i]; fix U[source] = 0; |
The bonus points require a couple of extra binary variables:
/* East-West and North-South bonuses */ num xmin = min {i in NODES} x[i]; num xmax = max {i in NODES} x[i]; num ymin = min {i in NODES} y[i]; num ymax = max {i in NODES} y[i]; set BONUSES = 1..2; set NODES_b {BONUSES} init {}; for {i in NODES: x[i] = xmin} do; NODES_b[1] = NODES_b[1] union {i}; leave; end; for {i in NODES: x[i] = xmax} do; NODES_b[1] = NODES_b[1] union {i}; leave; end; for {i in NODES: y[i] = ymin} do; NODES_b[2] = NODES_b[2] union {i}; leave; end; for {i in NODES: y[i] = ymax} do; NODES_b[2] = NODES_b[2] union {i}; leave; end; put NODES_b[*]=; var IsBonus {BONUSES} binary; con IsBonusCon {b in BONUSES, i in NODES_b[b]}: IsBonus[b] <= UseNode[i]; |
We can have two objectives, minimize distance given a target point value or maximize points given a limited distance:
max TotalScore = sum {i in NODES} score[i] * UseNode[i] + &east_west_bonus * IsBonus[1] + &north_south_bonus * IsBonus[2]; min TotalDistance = sum {<i,j> in ARCS} distance[i,j] * UseArc[i,j]; |
Technical details
The problem is modeled using PROC OPTMODEL in SAS/OR 14.3. The optimization problems are solved with the mixed integer linear programming (MILP) solver. It takes on average about half a minute to find the course with the most points given a distance budget, and it takes only a couple of seconds to potentially shorten the course.
Results
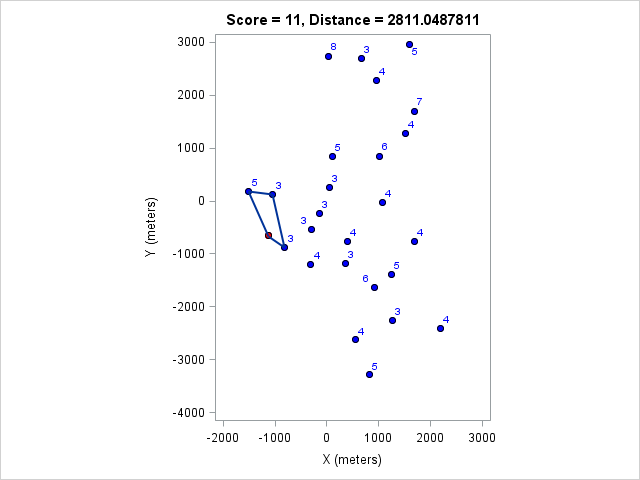
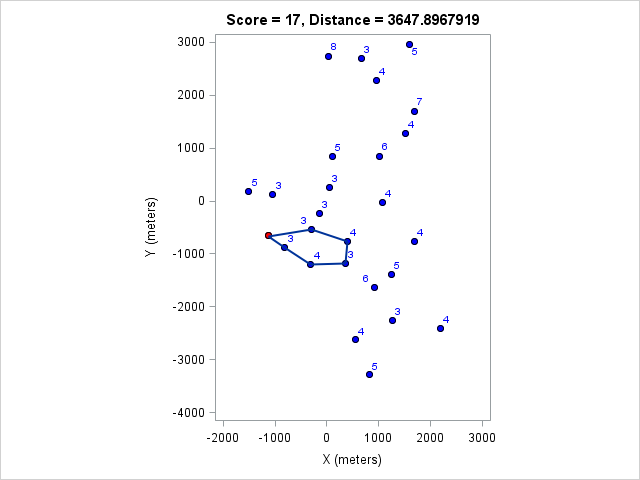
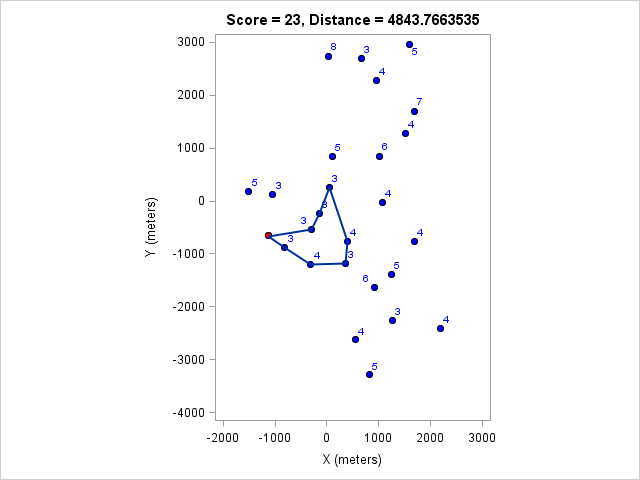
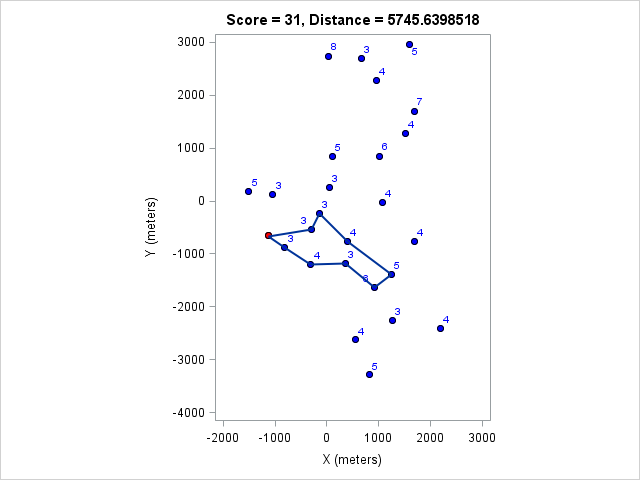
I ran the model for various course lengths to get the course with the most points. Then I fixed the number of points and found the shortest course that achieves that. These are listed in the following table:
| Distance (m) | Points |
|---|---|
| 2811 | 11 |
| 3648 | 17 |
| 4844 | 23 |
| 5746 | 31 |
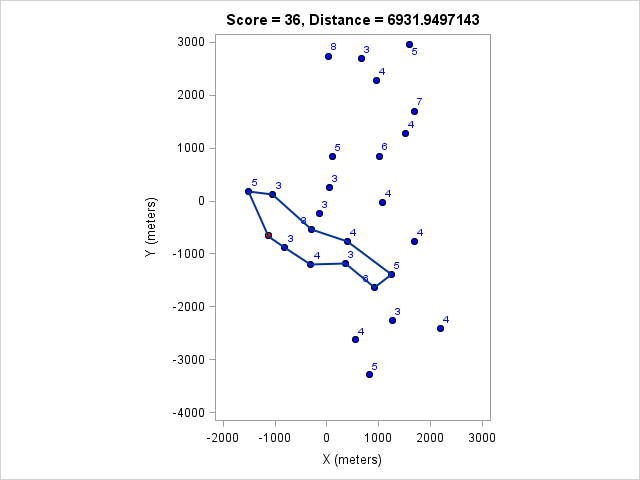
| 6932 | 36 |
| 7828 | 42 |
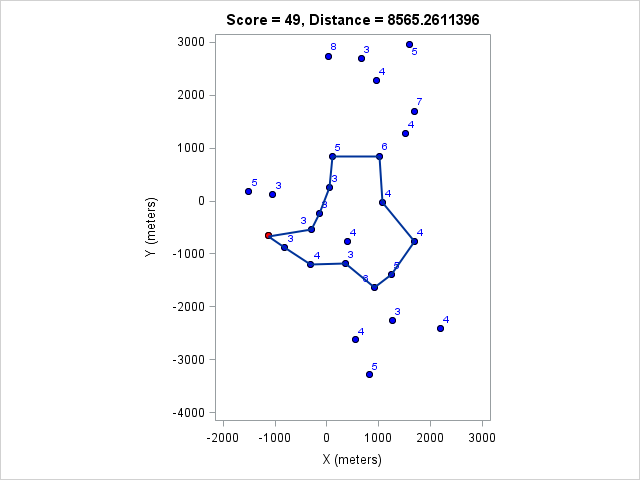
| 8565 | 49 |
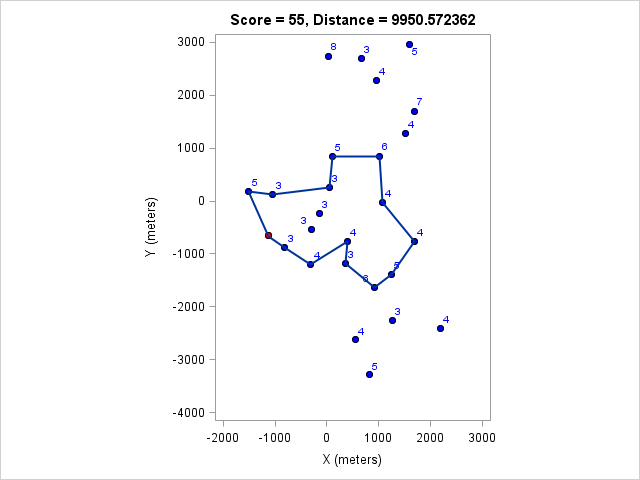
| 9950 | 55 |
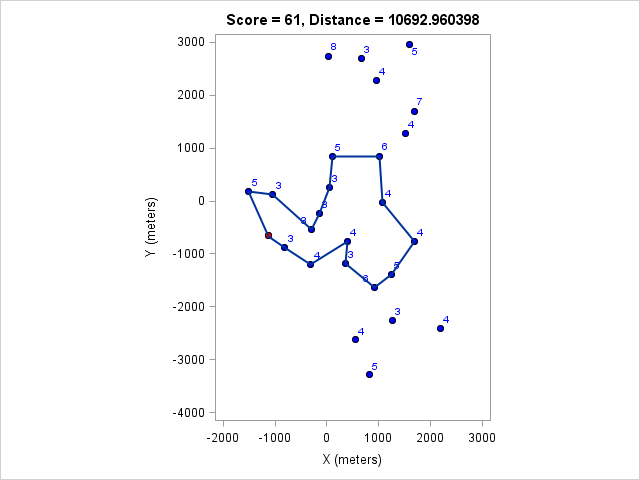
| 10693 | 61 |
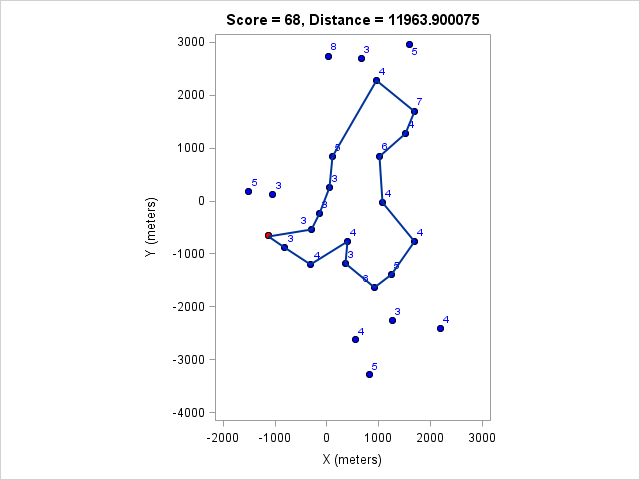
| 11964 | 68 |
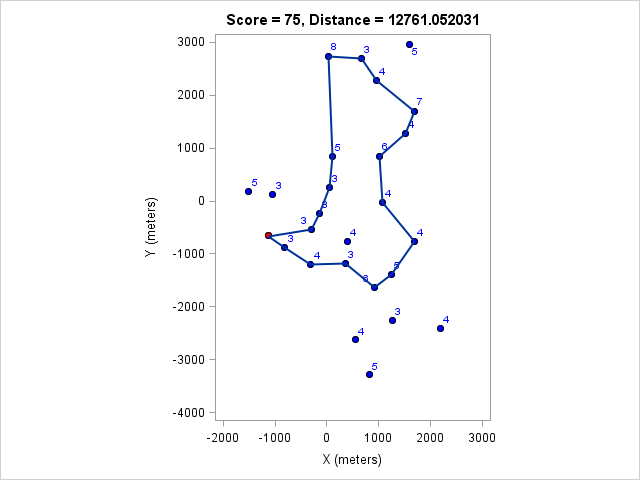
| 12761 | 75 |
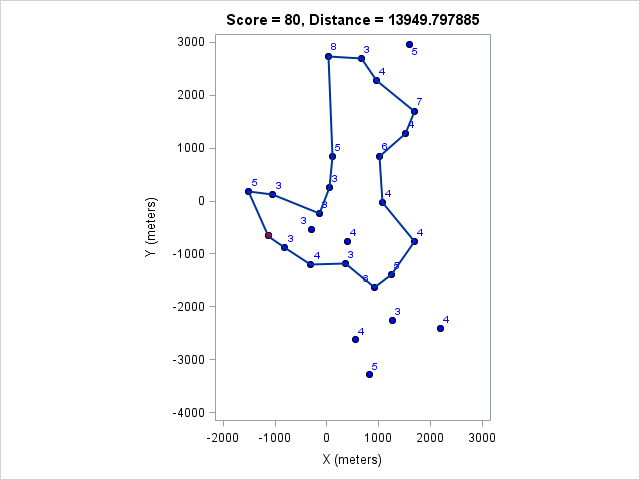
| 13950 | 80 |
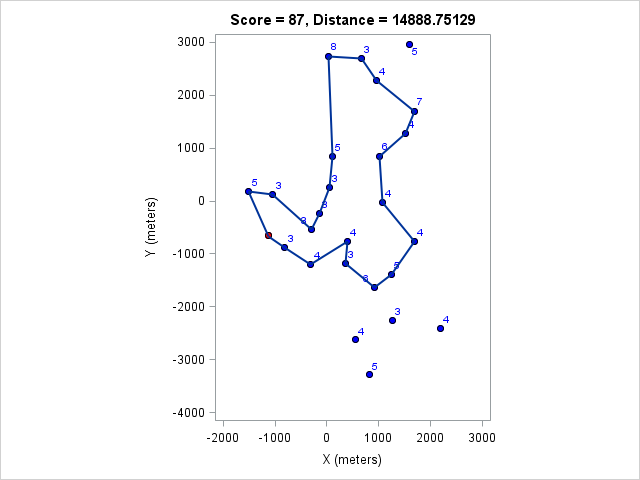
| 14889 | 87 |
| 15790 | 89 |
| 16856 | 97 |
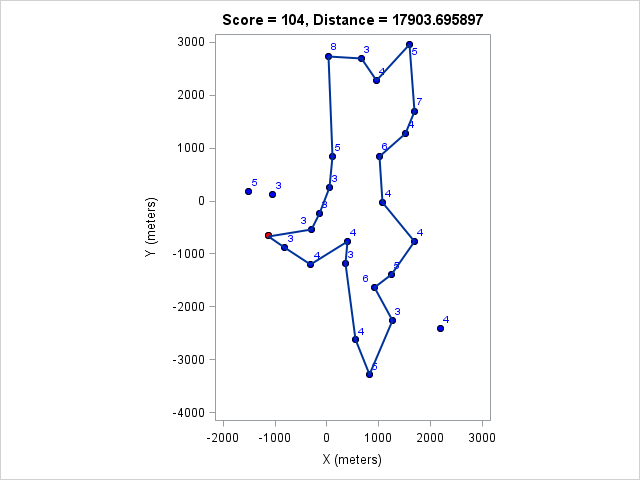
| 17904 | 104 |
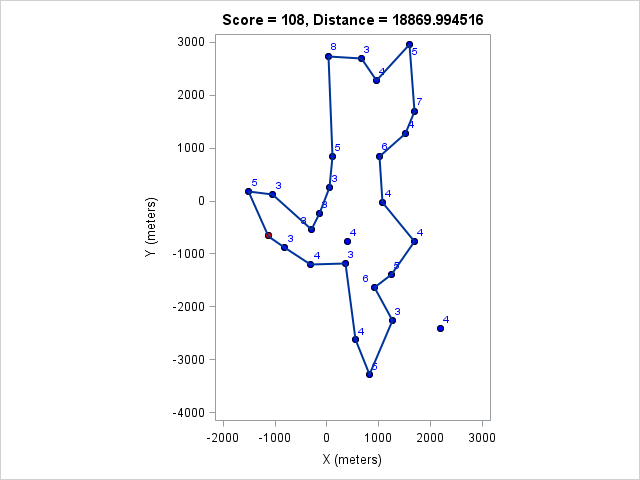
| 18870 | 108 |
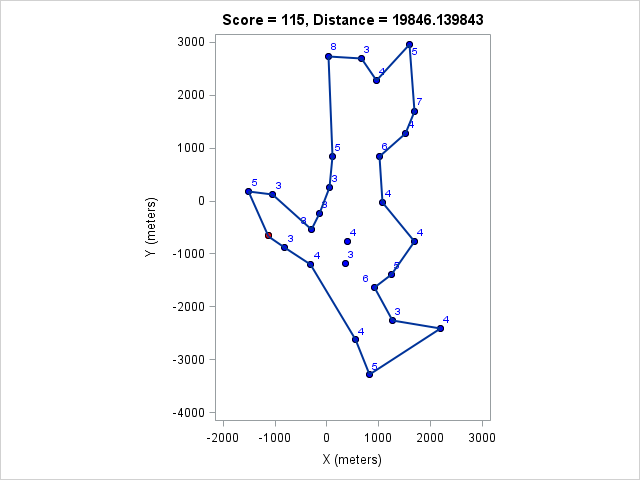
| 19846 | 115 |
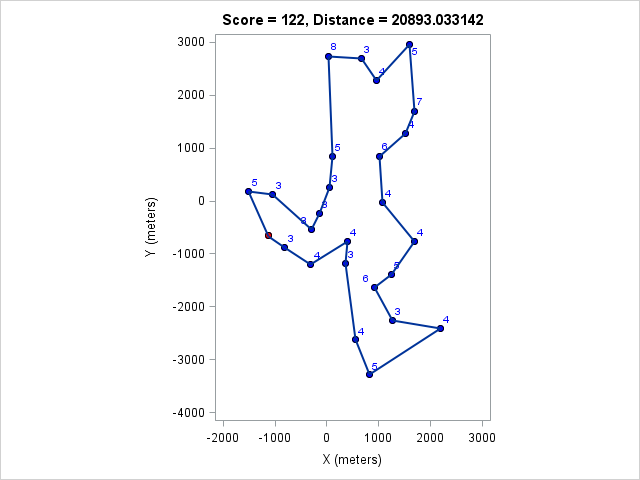
| 20893 | 122 |
You can click on each distance to get the optimal course for that distance. Because I optimized the course lengths, the table can be read from left to right to get the most points given a distance or right to left to get the minimum distance given a target point value.
Browsing those routes reveals some interesting insights. The East-West bonus wasn't worth the effort, even though it looked enticing and definitely doable within two hours. Turns out there weren't enough high-valued control points around those two to make it worth it. On the other hand the North-South bonus was worth it as long as a course longer than 17km (or at least 97 points) was targeted. We can also see that 1km of distance is worth about 5-7 points, which is an important number when one wants to decide how far to run for a control.
Here are a few plots of optimal courses of a given length. First, a course that visits all the controls. It is just under 21km long:
Then let us see what I should have done given the condition I set out to myself that the nominal course length should be less than 8km:
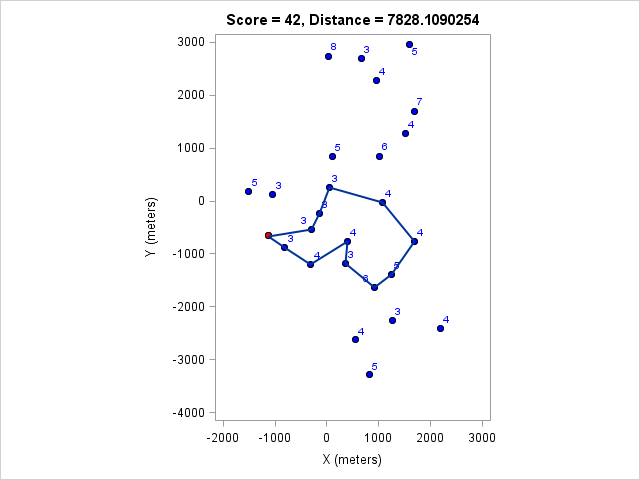
If I had managed to complete this course I would have been tied for third place. Finally, the optimal course for my pace in the four-hour race:
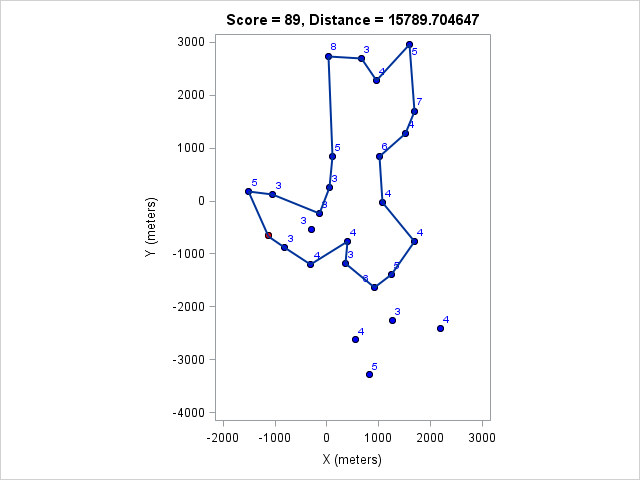
This score would have won the four-hour race. It is interesting that it doesn't require either of the bonuses.
My race
And what happened at the race? I had 24 points halfway through the race. Then I got greedy and decided to go for the East-West bonus. I lost a lot of time on the East control, had to give up the West control, and had only 30 minutes to get back to the finish. I went 8 minutes overtime and finished with only 15 points. On the upside, I ran 13km in 128 minutes, which is right on target for my 12km/120min original estimate. The nominal length of my course was 8.8km, a bit more than I projected, and that is probably why I couldn't finish on time. I should have headed back toward the finish and picked up a few more controls in that area instead. In any case, it was a good lesson in orienteering as well as in optimization.
You can find the race information here and the results here. If you are interested in participating in a similar event this year you can find the necessary information here. I will be there, hopefully armed with a better strategy this year.
Thanks to Rob Pratt for providing the code I used in this blog post. The code and the data can be downloaded from here.
