Tag: Graph Builder

2
Interactive HTML: Points, box plots and more for Graph Builder

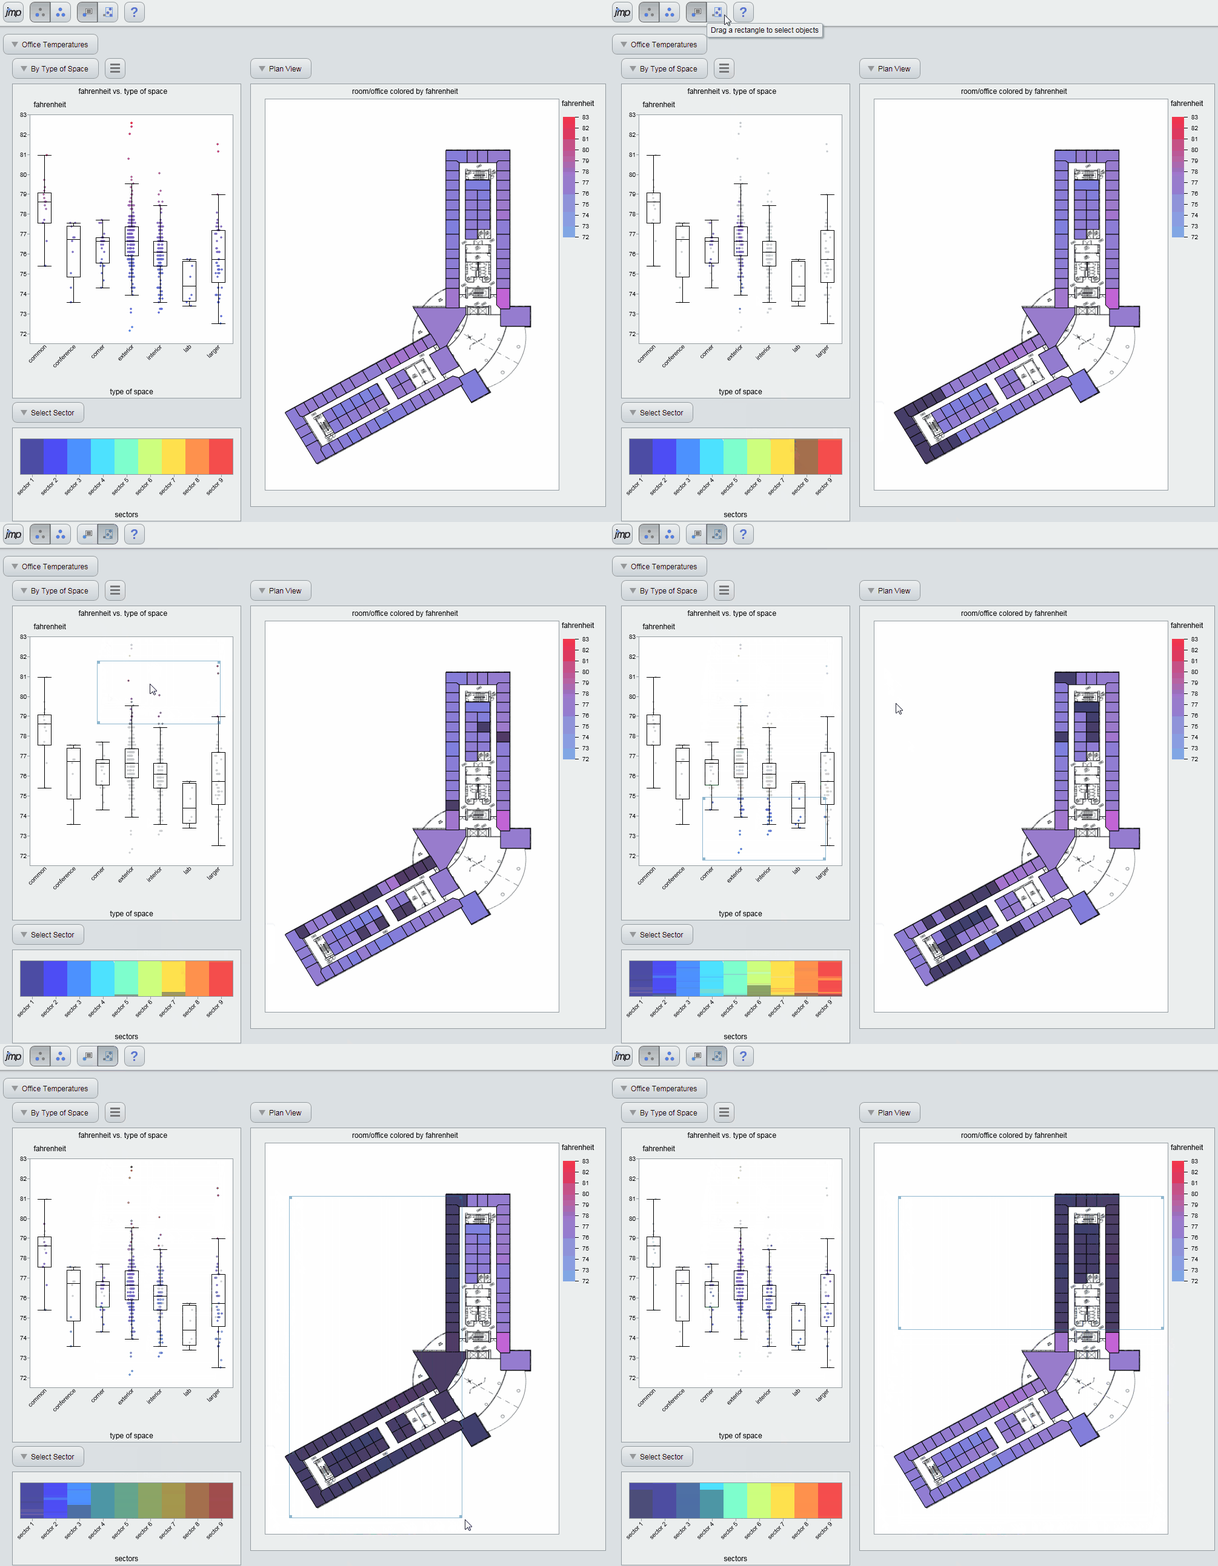
This is a continuation of a series of blog posts on interactive HTML for Graph Builder reports in JMP 13. Here, I'm discussing support for Points, Box Plots, Heat Maps and Map Shapes. These Graph Builder elements are highlighted in the figure below. Since this blog post describes interactive web

0
Interactive HTML: Graph Builder and more in JMP 13

In JMP 11, we built interactive HTML technology into JMP to enable customers to share results. You can publish JMP results to the Web, post them to a corporate intranet or shared drive, or share them with colleagues via e-mail. In JMP 12, we added support for Bubble Plots, Profilers

0
Looking at Summer Games data with JMP

You might say I love sports. I began swimming at a very early age and participated on swim teams for many years. Gymnastics, volleyball, softball, basketball and even track teams were all part of my life, and I loved playing and competing. So maybe that is why I always love

4
JMP 13 Preview: Interactive HTML comes to Graph Builder

With interactive HTML reports, you can easily share the results of your analysis with a broader community while retaining the ability to interact with graphs and data. All you need is a web browser. Soon after interactive HTML became available for many JMP reports in JMP 11, customers began asking

0
JMP 13 Preview: Customer-driven Graph Builder improvements

Graph Builder is one of the most-used parts of JMP. As a result, the drag-and-drop graph creation platform receives a large number of customer requests for features and changes. The next version of JMP includes many Graph Builder improvements that directly resulted from these requests. One big example are the

0
What’s coming in JMP 13? More customer-driven features

It’s that time again! A new version of JMP will be released soon – next month, in fact, on the day that JMP creator John Sall gives his keynote speech at Discovery Summit. What’s in this new version? There’s a lot to get excited about. That’s why the JMP Blog

1
Exploring 30 years of car colors

Montgomery County, Maryland, publishes all traffic violations since 2013, now totaling more than 780,000 incidents. Besides the location and details of the violations, the table also contains information about the vehicles involved, such as make, model, year and color. It’s car colors that I want to explore here. Even though

1
Graph Makeover: Bars on a log scale

Every once in a while, I run across a bar chart on a log scale, and it always feels wrong. At first glance, I compare the bar lengths and start making comparisons. But eventually, I notice the log scale on the axis and try to convince my brain to forget everything

1 2 3 6