2
Interactive HTML: Points, box plots and more for Graph Builder

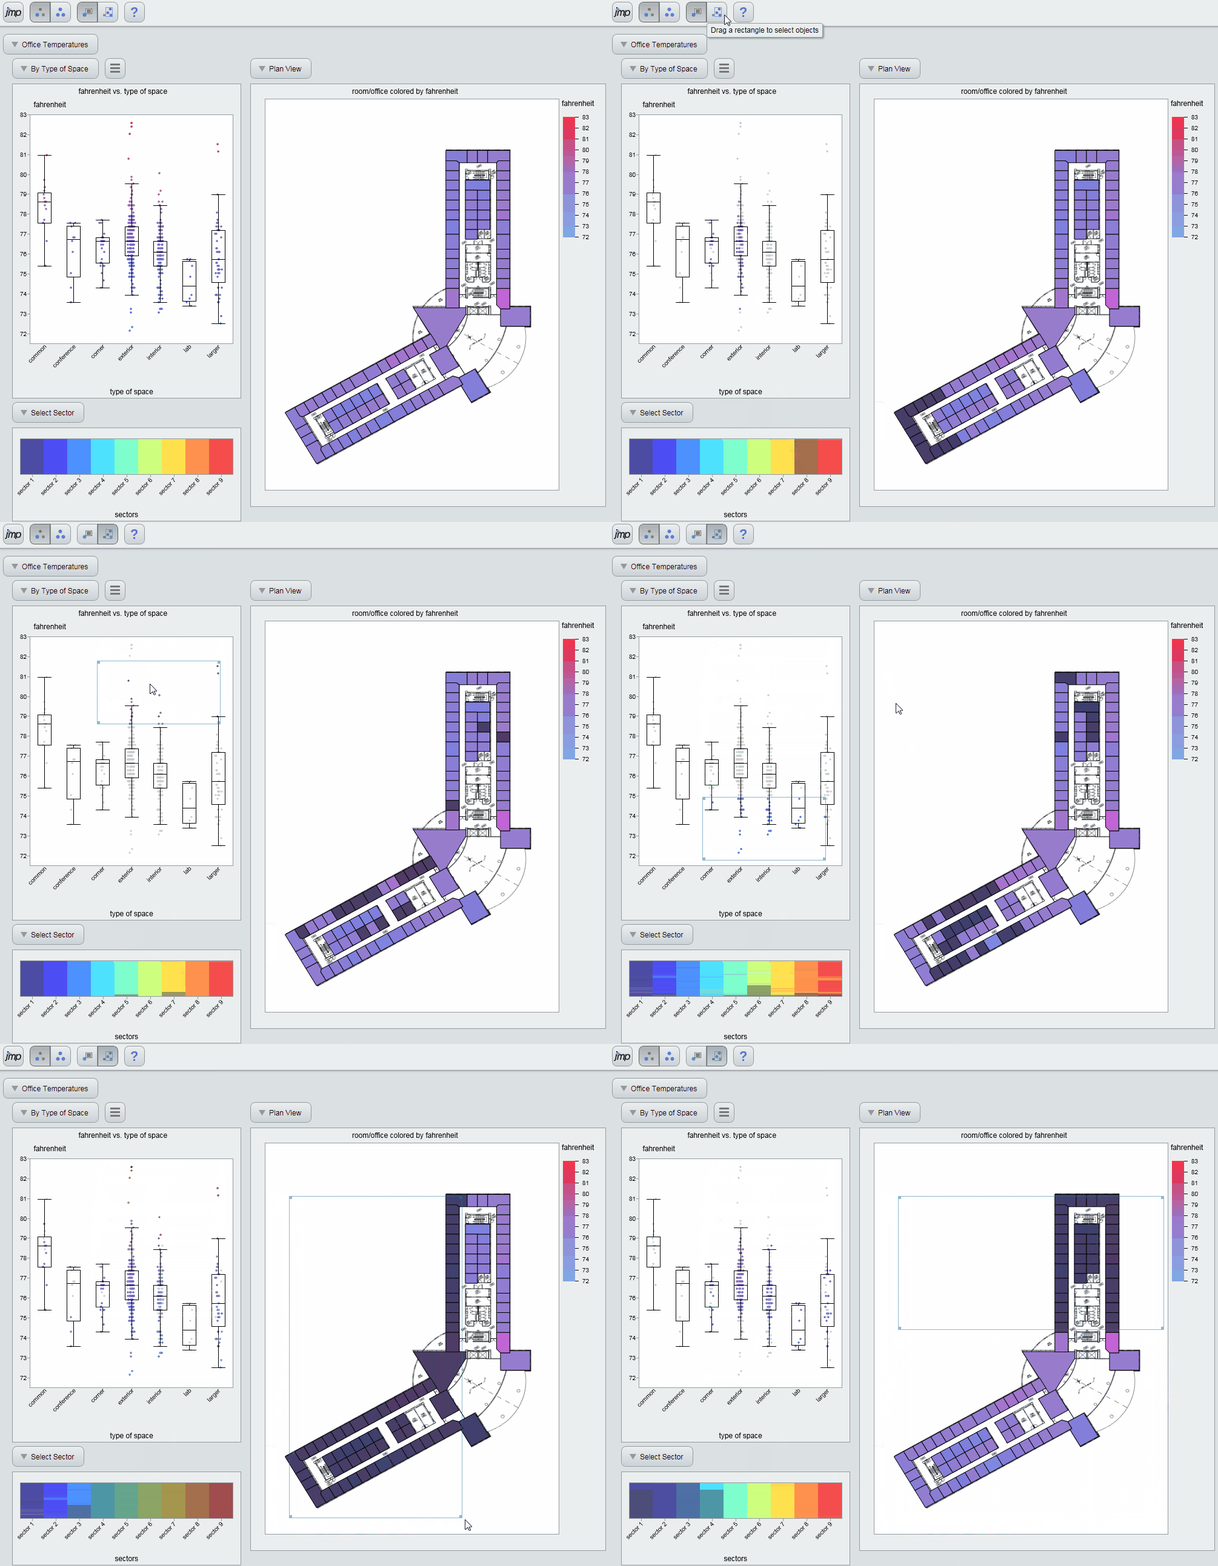
This is a continuation of a series of blog posts on interactive HTML for Graph Builder reports in JMP 13. Here, I'm discussing support for Points, Box Plots, Heat Maps and Map Shapes. These Graph Builder elements are highlighted in the figure below. Since this blog post describes interactive web

4
Is that the best (distribution) you've got?

As data analysts, we all try to do the right thing. When there is a choice of statistical distributions to be used for a given application, it’s a natural inclination to try to find the “best” one. But beware... Fishing for the best distribution can lead you into a trap.

2
Entertaining thing-explaining with Randall Munroe

Popular xkcd comic and author, Randall Munroe, delivered a fantastic closing plenary, Complicated Stuff in Simple Words, at JMP Discovery Summit last month. Based on his very popular second book, Thing Explainer: Complicated Stuff in Simple Words, it was hugely entertaining, and we are sharing it as this month’s episode of

0
13 things to know about JMP documentation

Writing JMP documentation is a team effort. Susan Conaghan, Michael Crotty, Colleen McKendry, Karen Copeland and I work with JMP developers, technical support, and other subject matter experts to provide you with help so that you can quickly create and interpret your JMP reports and graphs. There’s so much to

0
New sample data tables in JMP 13

By now, you’ve probably seen and heard about a lot of the new features that are available in JMP 13 and JMP Pro 13. To help demonstrate those features, the documentation team has added nearly 60 new sample data tables to the Sample Data Library. As a reminder, you can

0
Best in show at Discovery Summit 2016

Discovery Summit 2016 wrapped up with an announcement of the top-rated papers and posters. The selection is based on the ratings attendees submitted in the conference app. After the last breakout presentations of the conference were finished, we exported the ratings data from the app and brought it into JMP

0
Interactive HTML: Graph Builder and more in JMP 13

In JMP 11, we built interactive HTML technology into JMP to enable customers to share results. You can publish JMP results to the Web, post them to a corporate intranet or shared drive, or share them with colleagues via e-mail. In JMP 12, we added support for Bubble Plots, Profilers

0
Live blog of Randall Munroe keynote

Randall Munroe of the popular webcomic xkcd takes the stage at Discovery Summit today. He will discuss "Complicated Stuff in Simple Words" in his keynote. The author of the science question-and-answer blog What If, Munroe was born in Easton, Pennsylvania, and grew up outside Richmond, Virginia. After studying physics at

0
Live blog of Chris Nachtsheim keynote

Christopher Nachtsheim is the Frank A. Donaldson Chair of Operations Management in the Carlson School of Management at the University of Minnesota. Nachtsheim's teaching and research interests center on the optimal design of industrial experiments, regression and predictive analytics and quality management. He has co-written several related books, most notably Applied

1 2 3 4 5 121