Tag: Math

Rick Wicklin 3
Visualize a torus in SAS

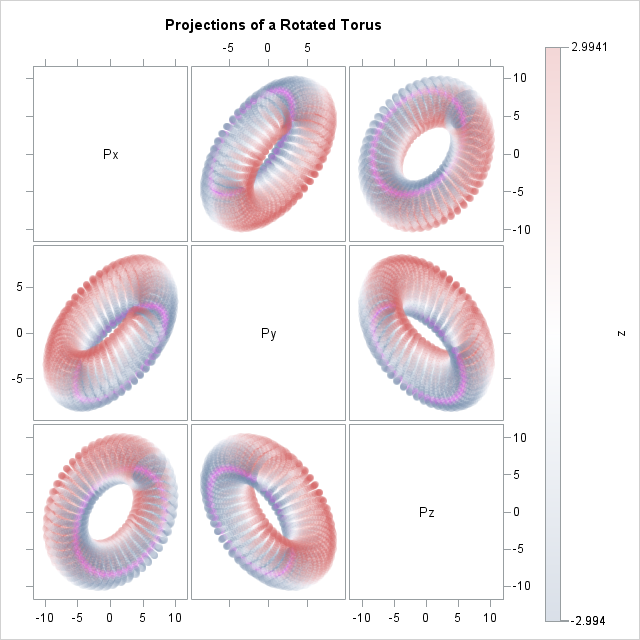
This article uses graphical techniques to visualize one of my favorite geometric objects: the surface of a three-dimensional torus. Along the way, this article demonstrates techniques that are useful for visualizing more mundane 3-D point clouds that arise in statistical data analysis. Define points on a torus A torus is

Learn SAS
Rick Wicklin 6
What is a moving average?

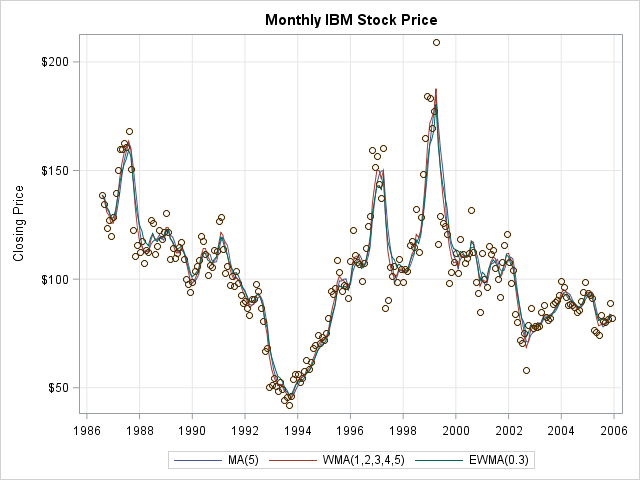
A moving average (also called a rolling average) is a statistical technique that is used to smooth a time series. Moving averages are used in finance, economics, and quality control. You can overlay a moving average curve on a time series to visualize how each value compares to a rolling

Rick Wicklin 14
Lo, how a polar rose e'er blooming

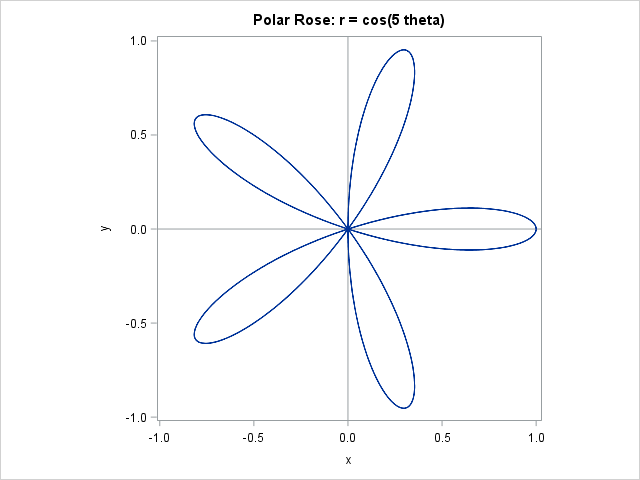
Lo how a rose e'er blooming From tender stem hath sprung As I write this blog post, a radio station is playing Chrismas music. One of my favorite Christmas songs is the old German hymn that many of us know as "Lo, How a Rose E're Blooming." I was humming

Rick Wicklin 20
The spiral of splatter

"Daddy, help! Help me! Come quick!" I heard my daughter's screams from the upstairs bathroom and bounded up the stairs two at a time. Was she hurt? Bleeding? Was the toilet overflowing? When I arrived in the doorway, she pointed at the wall and at the floor. The wall was

Rick Wicklin 7
Computing polar angles from coordinate data

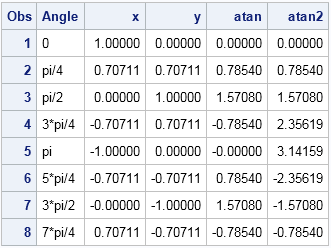
Equations that involve trigonometric functions can have infinitely many solutions. For example, the solution to the equation tan(θ)=1 is θ = π/4 + kπ, where k is any integer. In order to obtain a unique solution to the equation, we define the "arc" functions: inverse trigonometric functions that return a

Rick Wicklin 8
The distribution of Pythagorean triples by angle

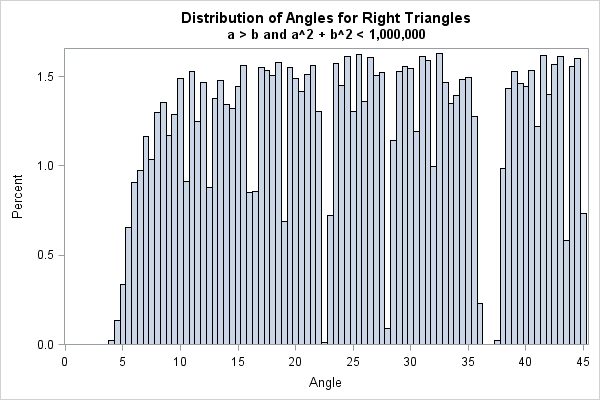
Last week I was chatting with some mathematicians and I mentioned the blog post that I wrote last year on the distribution of Pythagorean triples. In my previous article, I showed that there is an algorithm that uses matrix multiplication to generate every primitive Pythagorean triple by starting with the

Rick Wicklin 6
Pascal's triangle in SAS

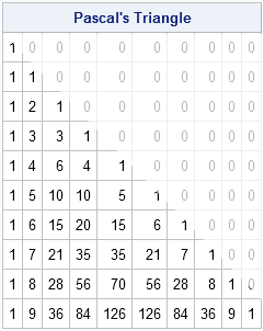
Pascal's triangle is the name given to the triangular array of binomial coefficients. The nth row is the set of coefficients in the expansion of the binomial expression (1 + x)n. Complicated stuff, right? Well, yes and no. Pascal's triangle is known to many school children who have never heard of polynomials