A previous article describes how to use the SGPANEL procedure to visualize subgroups of data. It focuses on using headers to display information about each graph. In the example, the data are time series for the price of several stocks, and the headers include information about whether the stock price increased, decreased, or stayed the same during a time period. The previous article discusses several advantages and disadvantages of using the SGPANEL procedure for this task.
An alternative approach is to use the BY statement in the SGPLOT procedure to process each subgroup separately. This article shows how to use the #BYVAR and #BYVAL keywords in SAS titles to display information about the data in each subgroup.
The example data
I will use the same data as for the previous article. In real life, you would use a separate analysis to determine whether each stock increased or decreased, but I will hard-code this information for the three stocks in the example data.
The following DATA step creates a subset of the Sashelp.Stocks data. The STOCK variable contains the name of three stocks: IBM, Intel, and Microsoft. The OPEN variable contains the opening stock price for these companies for each month. The DATA step restricts the data to the time period Jan 1998 – May 2000. The TREND variable indicates whether the stock price increased or decreased during the time period.
data Have; set Sashelp.Stocks; where '01Jan1998'd <= Date <= '30May2000'd; /* prepare data to display information */ if Stock='IBM' then Trend='Neutral '; else if Stock='Intel' then Trend='Increasing'; else if Stock='Microsoft' then Trend='Decreasing'; run; /* NOTE: The Sashelp.Stock data set is already sorted by Stock and by Date. Be sure to sort your data if you want to use the BY statement. For example: proc sort data=Have; by Stock Date; run; */ |
You must sort the data for BY-group processing. The example data are already sorted by the STOCK variable, which is the grouping variable. And within each stock, the data are sorted by the DATE variable, which is important for visualizing the stock prices versus time.
Titles for BY-group analysis
When you run a BY-group analysis, SAS automatically creates a title that indicates the name and value of the BY-group variable(s). (This occurs whenever the BYLINE option is on, and it is on by default.) SAS looks at how many titles you have specified and uses the next available title to display the BY-group information. For example, without doing anything special, you can use the standard BY-group analysis to graph the prices for all three stocks in the data set:
/* assume OPTION BYLINE is set */ title "Stock Price Jan 1998 - May 2000"; /* the BY-line will appear in the TITLE2 position */ proc sgplot data=Have; by Stock; series x=Date y=Open / lineattrs=(thickness=2); yaxis grid label="Stock Price"; /* optional: min=50 max=210 */ xaxis display=(nolabel); run; |
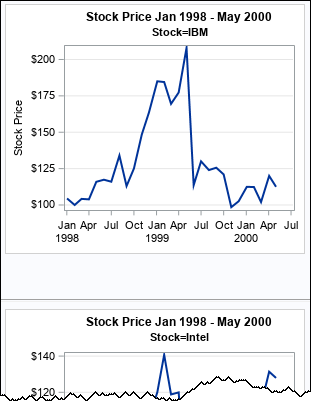
To save space, I have truncated the output. Each graph shows only a subset of the data. The TITLE2 line displays the name of the BY-group variable (Stock) and the value of the variable. All this happens automatically.
Customize titles: The #BYVAL substitution
The TITLE and TITLEn statements in SAS support substituting the values of a BY-group variable. You can insert the name of a BY-group variable by using the #BYVARn keyword. You can insert the name of a BY-group value by using the #BYVALn keyword. When using these text substitutions, you should specify OPTIONS NOBYLINE to suppress the automatic generation of subtitles.
By default, the BY statement generates the plots one after another, as shown in the previous example. However, you can use the ODS LAYOUT GRIDDED statement to arrange the graphs in a lattice. Essentially, you are using ODS to replicate the layout that PROC SGPANEL handles automatically. In the following example, I let the vertical scale of the axes vary according to the values for each BY group. If you prefer, you can use the MIN= and MAX= options on the YAXIS statement to specify a range of values for each axis.
/* layout the graphs. Use the #BYVALn values to build the titles */ ods graphics / width=300px height=250px; /* make small to fit on page */ options nobyline; /* suppress Stock=Value title */ ods layout gridded columns=3 advance=table; /* layout in three columns */ title "BY-Group Analysis of the #byvar1 Variable";/* substitute variable name for #BYVAR */ title2 "Time Series for #byval1"; /* substitute name of stock for #BYVAL */ proc sgplot data=Have; by Stock; series x=Date y=Open / lineattrs=(thickness=2); yaxis grid label="Stock Price"; /* optional: min=50 max=210 */ xaxis display=(nolabel); run; ods layout end; /* end the gridded layout */ options byline; /* turn the option on again */ |
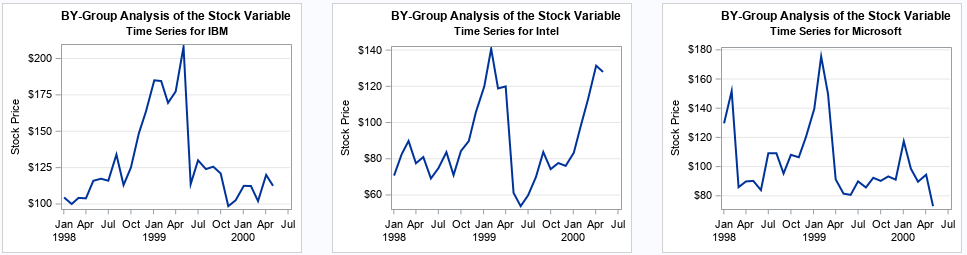
Now you can see the power of the #BYVAL keyword. (Click the graph to enlarge it.) It gives you great flexibility in creating a custom subtitle that contains the value of the BY-group variable. The keywords #BYVAR and #BYVAL are an alias for #BYVAR1 and #BYVAL1, just like TITLE is an alias for TITLE1. The next example uses a second BY-group variable.
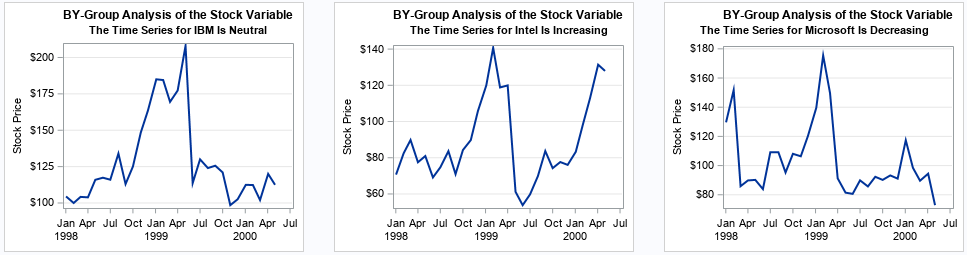
Because the BY statement supports multiple BY-group variables and because you can specify the NOTSORTED option for variables that are not sorted, you can include the TREND variable as a second BY=group variable. You can then use both the #BYVAL1 and #BYVAL2 keywords to further customize the titles:
options nobyline; /* suppress Stock=Value title */ ods layout gridded columns=3 advance=table; /* layout in three columns */ title2 "The Time Series for #byval1 Is #byval2"; /* substitute stock name and trend value */ proc sgplot data=Have; by Stock TREND notsorted; series x=Date y=Open / lineattrs=(thickness=2); yaxis grid label="Stock Price"; /* optional: min=50 max=210 */ xaxis display=(nolabel); run; ods layout end; /* end the gridded layout */ options byline; /* turn the option on again */ |
Controlling attributes in a BY-group
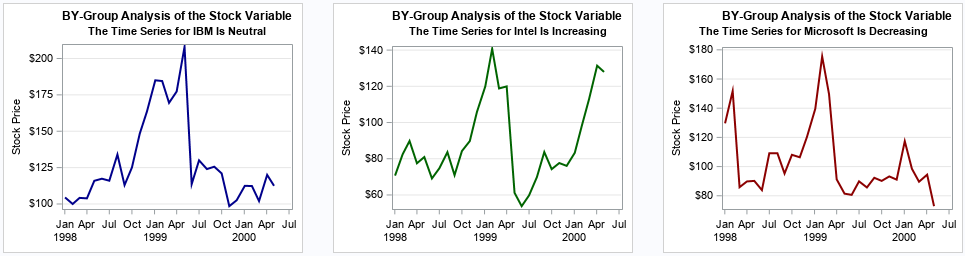
I have one more tip. You can use a discrete attribute map to link the attributes of markers and lines to the value of a variable in the data. For example, suppose you want to color the lines in these plots according to whether the stock price increased, decreased, or stayed the same. The following DATA step creates a discrete attribute map that assigns the line colors based on the value in the TREND variable. On the PROC SGPLOT statement, you can use the DATTRMAP= option, which makes the data map available to the procedure. You can add the ATTRID= option to the SERIES statement. Because the colors are determined by the GROUP=TREND option, the procedure will look at the attribute map to determine which color to use for each line.
/* Create a discrete attribute map. Line color is determined by the TREND value. */ data Attrs; length Value $20 LineColor $20; ID = "StockTrend"; Value='Neutral'; LineColor = "DarkBlue "; output; Value='Increasing'; LineColor = "DarkGreen "; output; Value='Decreasing'; LineColor = "DarkRed "; output; run; options nobyline; /* suppress Stock=Value title */ ods layout gridded columns=3 advance=table; /* layout in three columns */ proc sgplot data=Have noautolegend DATTRMAP=Attrs; by Stock Trend notsorted; series x=Date y=Open / group=Trend ATTRID=StockTrend lineattrs=(thickness=2); yaxis grid label="Stock Price"; xaxis display=(nolabel); run; ods layout end; /* end the gridded layout */ options byline; /* turn the option on again */ |
Summary and further reading
This article shows how to customize the title and attributes in graphs that are generated as part of a BY-group analysis. You can use the #BYVARn and #BYVALn keywords to insert information about the BY groups into titles. You can use a discrete attribute map to link attributes in a graph (such as line color) to the values of a variable in the data. Although creating a sequence of graphs by using a BY-group analysis is a powerful technique, I often prefer to use PROC SGPANEL, for the reasons discussed in a previous article. PROC SGPANEL provides support for controlling many features of the graphs and the layout of the graphs.
If you are interested in the SAS Macro solution to creating titles, you can read the original thread and solution on the SAS Support Communities. For more information about using the #BYVAR and #BYVAL keywords in SAS titles, see- Carpenter, A. (1998) "Better Titles: Using The #BYVAR and #BYVAL Title Options"

3 Comments
#BYVAR and ODS LAYOUT are applied well for PDF file, using ODS PDF. However, how about RTF file? ODS LAYOUT is not applied to ODS RTF. I tried to use COLUMNS= in ODS RTF statement, but it doesn't display well, there are many spaces between the graphs, is there a better way? My codes are as below:
data Have;
set Sashelp.Stocks;
where '01Jan1998'd <= Date <= '30May2000'd;
/* prepare data to display information */
if Stock='IBM' then Trend='Neutral ';
else if Stock='Intel' then Trend='Increasing';
else if Stock='Microsoft' then Trend='Decreasing';
run;
proc sort data=Have;
by Stock Date;
run;
title;
footnote;
ods graphics / width=800px height=700px; /* make small to fit on page */
ods rtf file="...\test.rtf" columns=3; /* specify the number of graphs to display across the page*/
options nobyline; /* suppress Stock=Value title */
ods layout gridded columns=3 advance=table; /* layout in three columns */
title2 "The Time Series for #byval1 Is #byval2"; /* substitute stock name and trend value */
proc sgplot data=Have;
by Stock TREND notsorted;
series x=Date y=Open / lineattrs=(thickness=2);
yaxis grid label="Stock Price"; /* optional: min=50 max=210 */
xaxis display=(nolabel);
run;
ods layout end; /* end the gridded layout */
options byline; /* turn the option on again */
ods rtf close;
In the article about ODS LAYOUT GRIDDED, I state, "Gridded layout is supported for HTML, POWERPOINT, and the PRINTER family of destinations (PDF, PS, and PCL). It is not supported for other destinations such as RTF or LISTING."
If you have questions about creating reports in various ODS destinations, you can ask them at the SAS Support Community for ODS and Base Reporting.
Pingback: 10 tips for creating effective statistical graphics - The DO Loop