Last year, I wrote more than 100 posts for The DO Loop blog. The most popular articles were about SAS programming tips for data analysis, statistical analysis, and data visualization. Here are the most popular articles from 2019 in each category.
SAS programming tips
- Create training, testing, and validation data sets:: This post shows how to create training, validation, and test data sets in SAS. This technique is popular in data science and machine learning because you typically want to fit the model on one set of data and then evaluate the goodness of fit by using a different set of data.
- 5 reasons to use PROC FORMAT to recode variables in SAS: Often SAS programmers use PROC SQL or the SAS DATA step to create new data variables to recode raw data. This is not always necessary. It is more efficient to use PROC FORMAT to recode the raw data. Learn five reasons why you should use PROC FORMAT to recode variables.
- Conditionally append observations to a data set: In preparing data for graphing. you might want to add additional data to the end of a data set. (For example, to plot reference lines or text.) You can do this by using one DATA step to create the new observations and another DATA step to merge the new observations to the end of the original data. However, you can also use the END= option and end-of-file processing to append new observations to data. Read about how to use the END= option to append data. The comments at the end of the article show how to perform similar computations by using a hash table, PROC SQL, and a DOW loop.
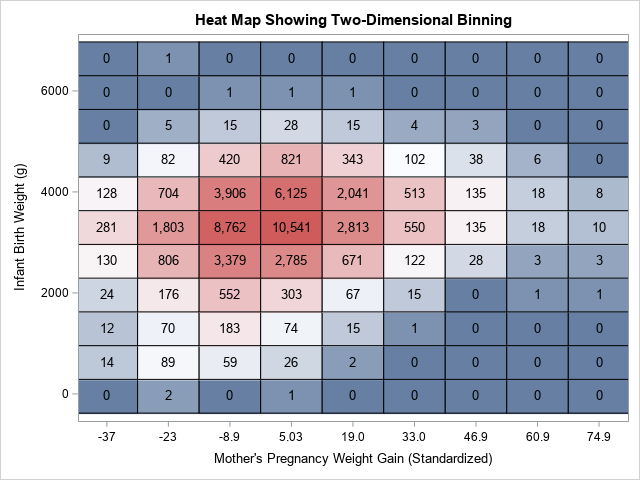
- Use PROC HPBIN to bin numerical variables: In machine learning, it is common to bin numerical variables into a set of discrete values. You can use PROC HPBIN to bin multiple variables in a single pass through the data. PROC HPBIN can bin data into equal-length bins (called bucket binning) or by using quantiles of the data. This article and the PROC FORMAT article are both referenced in my Essential Guide to Binning in SAS.
Statistical analyses
- Convergence issues in mixed models: This article discusses what to do if you are fitting a mixed model and receive a warning that "the estimated G matrix is not positive definite." I did not expect this to be among the year's most popular articles, but I guess a lot of people have convergence issues when fitting mixed models and are searching for a solution.
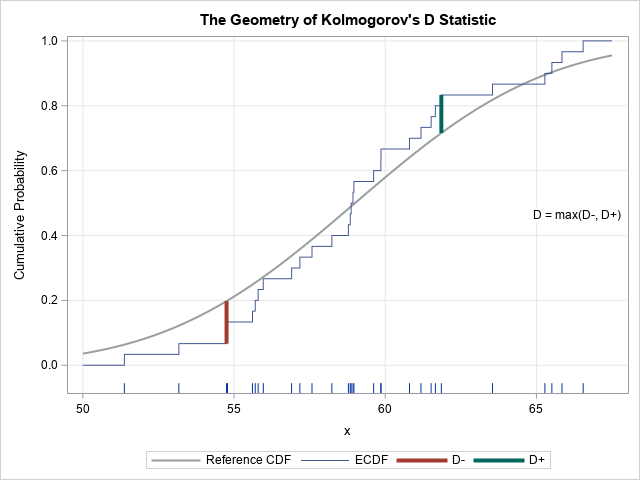
- Statistics for the Kolmogorov-Smirnov test: The Kolmogorov-Smirnov test is frequently chosen to test whether a distribution is normally distributed, although you can also use it to test for other distributions. The test statistic is called Kolmogorov's D statistic. I discuss the meaning of the Kolmogorov D statistic is and how to compute it in SAS. I also discuss the critical values of the Kolmogorov D statistic.
- An easier way to perform regression with restricted cubic splines: A new feature to the EFFECT statement in SAS/STAT 15.1 is support for the PERCENTILELIST option, which makes it easier to place knots for regression splines in regression.
- Compute the geometric mean, geometric standard deviation, and geometric CV: This post answers a common question on SAS discussion forums: How to compute the geometric mean, standard deviation, and CV in SAS.
Data visualization
- How to align the Y and Y2 axes: When you create a graph that contains two time series that have different scales, it is useful to display two axes. This article shows how to align the location of major tick marks on the axes.
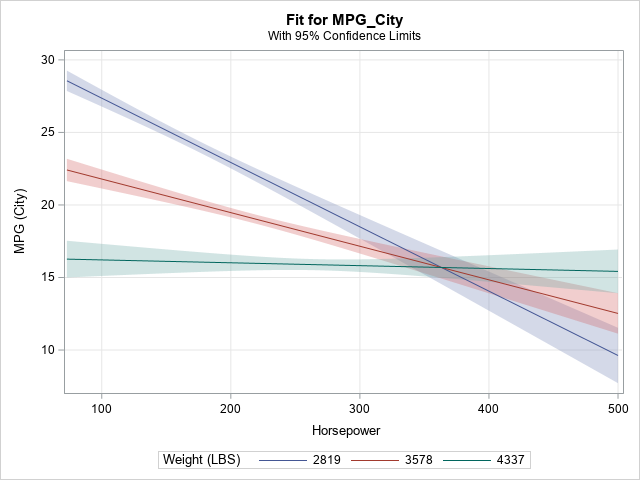
- Visualize interaction effects in regression models: The EFFECTPLOT statement in SAS enables you to create a plot that shows how the response variable depends on two regressors that might interact. Depending on the type of regressors (continuous or categorical), you can create three different plots that reveal whether the response depends on an interaction of two explanatory variables.
I always enjoy learning new programming methods, new statistical ideas, and new data visualization techniques. If you like to learn new things, too, read (or re-read!) these popular articles from 2019. Then share this page with a friend. I hope we both have many opportunities to learn and share together in the new year.

3 Comments
Thanks Rick for sharing your knowledge, learnings and tips. I've enjoyed reading your posts and look forward to looping round another DO LOOP blog post year!
The volume of technical material that you churn out on so many topics is astonishing. While you obviously have a very fertile mind, I'm sure this must also require a lot of hard work and research. So I second Michelle in thanking you for sharing all this knowledge. Once again in 2019, several times when I needed to "figure out" how to do something, a web search directed me to one of your blogs which showed me exactly what I needed!
Awesome! Thanks so much for sharing.