When you order an item online, the website often recommends other items based on your purchase. In fact, these kinds of "recommendation engines" contributed to the early success of companies like Amazon and Netflix. SAS uses a recommender engine to suggest articles on the SAS Support Communities. Although recommender engines use many techniques, one technique that estimates the similarity of items is the cosine similarity. You can use the cosine similarity to compare songs, documents, articles, recipes, and more.
This blog post demonstrates how to compute and visualize the similarities among recipes. For simplicity, only the ingredients in the recipes are used. You can extend the example by using the quantities of ingredients or by including other variables that describe the recipe, such as how the recipe is cooked (skillet, oven, grill, etc.).
The data: Ingredients for recipes
I looked up the ingredients for six recipes: spaghetti sauce, a spaghetti sauce with meat, an Italian eggplant relish (called caponata), a creole sauce, a salsa, and an enchilada sauce. Three recipes are Italian, one is creole, and two are Mexican. Four are sauces and two (salsa and eggplant relish) are typically appetizers. All have tomatoes (fresh, canned, or paste). The following DATA step defines the ingredients in each recipe by using a binary indicator variable. The 35 variables are the ingredients (tomato, garlic, salt, and so forth) and the six rows are the recipes.
data recipes; input Recipe $ 1-20 (Tomato Garlic Salt Onion TomatoPaste OliveOil Celery Broth GreenPepper Cumin Flour BrownSugar BayLeaf GroundBeef BlackPepper ChiliPowder Cilantro Carrot CayennePepper Oregano Oil Parsley PorkSausage RedPepper Paprika Thyme Tomatillo JalapenoPepper WorcestershireSauce Lime Eggplant GreenOlives Capers Sugar) (1.); datalines; Spag Sauce 1111110000000000000101000000000000 Spag Meat Sauce 1111111010001100010000110000000000 Eggplant Relish 0111110000000000000000000000001111 Creole Sauce 1011111110000010000000001100100000 Salsa 1111000000000000100000000011010000 Enchilada Sauce 1000000101110001001010000000000000 ; |
If you look carefully at the Eggplant Relish and Enchilada Sauce rows, you will see that they have no ingredients in common. Therefore, those recipes should be the most dissimilar.
The cosine similarity of recipes
In a previous article, I showed that you can use PROC DISTANCE in SAS to compute the cosine similarity of rows. Alternatively, you can use the SAS/IML language to define a function that computes the cosine similarity. The following SAS/IML program loads the function and creates a heat map of the similarity matrix for these six recipes:
proc iml; use Recipes; read all var _NUM_ into X[c=varNames r=Recipe]; close; load module=(CosSimRows); /* load module from previous post */ cosSim = CosSimRows(X); Colors = palette('BRBG', 7); /* brown-blue-green color ramp */ call heatmapcont(cosSim) xvalues=Recipe yvalues=Recipe range={0 1} colorramp=Colors title="Cosine Similarity of Recipes"; print CosSim[F=4.2 r=Recipe c=Recipe]; |
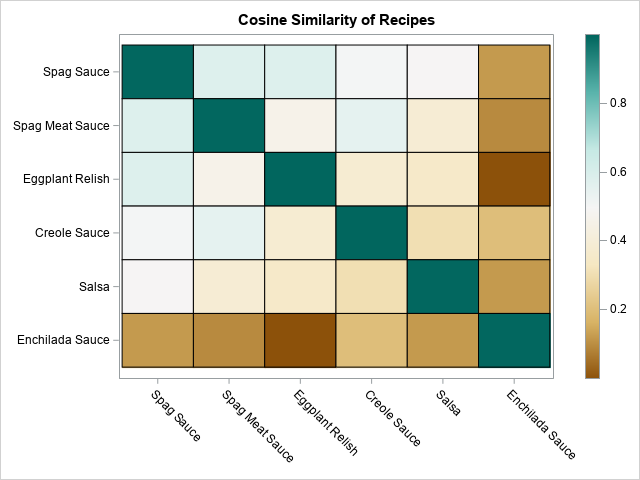
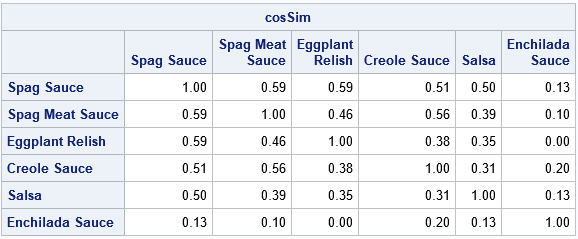
The heat map and printed table show the similarity scores for the six recipes. The following list summarizes the similarity matrix, which is based solely on the presence or absence of ingredients:
- The ingredients in the spaghetti sauce recipe are most similar to the meat sauce and the eggplant relish. They are slightly less similar to the creole sauce and salsa. They are not similar to the enchilada sauce ingredients.
- The ingredients in the spaghetti meat sauce are most similar to the spaghetti sauce and the creole sauce. They are slightly less similar to the eggplant relish and salsa. They are not similar to the enchilada sauce ingredients.
- The ingredients in the eggplant relish are similar to both spaghetti sauces. The recipe has zero similarity to the enchilada sauce recipe because they do not share any common ingredients.
- The ingredients in the creole sauce are similar to both spaghetti sauces.
- The salsa is most similar to the spaghetti sauce.
- The enchilada sauce recipe is not similar to any of the other recipes.
Of course, these results depend on what ingredients you use for the recipes. When I planned this study, I expected the salsa and enchilada sauce to be similar, but it turned out that the recipes had only one ingredient in common (tomatoes).
If you do not have very many items to compare, you can use a bar chart to visualize the pairwise similarities. The result is shown below. Even if you have too many items to display the full set of pairwise similarities, you could use a WHERE clause (such as WHERE CosSim > 0.5) to see only the most similar pairs of items.
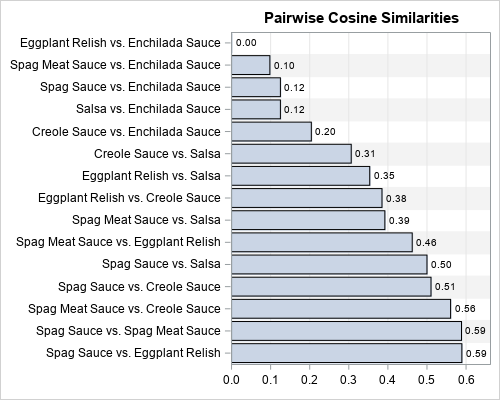
The bar chart is sorted by the cosine similarity, so it is easy to see the very similar and very dissimilar pairs.
Conclusions
A recommendation engine can use calculations like this to suggest additional recipes that are similar to those that you like. Did you like the spaghetti sauce recipe? Try the eggplant relish! Replace "recipe" with "movie," "book," or "product" and you begin to see how recommender engines work.
An advantage of the cosine similarity is that it preserves the sparsity of the data matrix. The data matrix for these recipes has 204 cells, but only 58 (28%) of the cells are nonzero. If you add additional recipes, the number of variables (the union of the ingredients) might climb into the hundreds, but a typical recipe has only a dozen ingredients, so most of the cells in the data matrix are zero. When you compare two recipes, only the common ingredients contribute to the cosine similarity score. This means that you can compute the cosine similarity very efficiently, and it requires making only a single pass through the data.
You can also compute the cosine similarity of the columns, which tells you which pairs of ingredients appear together in recipes. As you might imagine, olive oil, garlic, and onions are similar to each other because they often appear in recipes together. Cumin and green olive? Not very similar.

4 Comments
Thanks Rick. Useful back-to-school post for parents of kids who ask, "when will I ever use this stuff IRL." : )
I actually wrote a recent post on that exact topic: "The math you learned in school: Yes, it’s useful!"
Is there a way to find a similarity between two SAS Programs and extract matched lines (closer match)?
You can ask questions like this at the SAS Support Communities. It was probably you who asked this question yesterday.