Do you want to bin a numeric variable into a small number of discrete groups? This article compiles a dozen resources and examples related to binning a continuous variable. The examples show both equal-width binning and quantile binning. In addition to standard one-dimensional techniques, this article also discusses various techniques for 2-D binning.
SAS procedures that support binning include the HPBIN, IML, KDE, RANK, and UNIVARIATE procedures.
Equal-width binning in SAS
The simplest binning technique is to form equal-width bins, which is also known as bucket binning. If a variable has the range [Min, Max] and you want to split the data into k equal-width bins (or buckets), each bin will have width (Max - Min) / k.
- The simplest example of using binning is to create a histogram of a variable. The height of each bar is the number of observations in each bin. Although histograms in SAS automatically determine where to place bins, you can override the default bins and specify the location of bins in the HISTOGRAM statement in PROC UNIVARIATE and in PROC SGPLOT.
- Not only can you use a histogram to bin a continuous variable, you can output the endpoints of the bins (and the bin counts) to a SAS data set by using the OUTHIST= option on the HISTOGRAM statement in PROC UNIVARIATE.
- The HPBIN procedure performs equal-width binning by default, or if you specify the BUCKET option.
- You can use the BIN function in SAS/IML to assign observations to bins. If you use evenly spaced cutpoints, the data are split according to equal-width binning. You can also use the TABULATE subroutine to count the number of observations in each bin.
Quantile binning in SAS
In bucket binning, some bins have more observations than others. This enables you to estimate the density of the data, as in a histogram. However, you might want all bins to contain about the same number of observations. In that case, you can use quantiles of the data as cutpoints. If you want four bins, use the 25th, 50th, and 75th percentiles as cutpoints. If you want 10 bins, use the sample deciles as cutpoints. Here are several resources for quantile binning:
- The HPBIN procedure performs quantile and pseudo-quantile binning when you specify the QUANTILE and PSEUDO_QUANTILE options, respectively.
- Although PROC RANK is not as fast as PROC HPBIN, you can use the GROUPS= option on the PROC RANK statement to perform quantile binning. PROC RANK supports several ways to assign ranks to tied values.
- The previous item on this list creates a quantile bin plot where the quantiles of the X and Y variables are computed independently. You can also create a conditional quantile bin plot, which computes the quantiles of one variable and then computes the quantiles of the second variable conditioned on the quantiles of the first variable. The bins for the conditional quantile bin plot are not formed by the intersection of grid lines although they are still rectangles.
- No matter how you perform quantile binning, be aware that tied values in the data can result in some bins that contain more observations than others. Some people propose splitting the tied observations between bins, but I do not endorse that practice.
Binning by using arbitrary cutpoints in SAS
Sometimes you need to bin based on scientific standards or business rules. For example, the Saffir-Simpson hurricane scale uses specific wind speeds to classify a hurricane as Category 1, Category 2, and so forth. In these cases, you need to be able to define custom cutpoints and assign observations to bins based on those cutpoints.
- You can use PROC FORMAT in SAS to define arbitrary cutpoints and values (such as "Category 1", "Category 2", etc) for each bin. The beauty of using PROC FORMAT is that you do not need to create a new variable that contains the bin information; you simply apply the format to an existing variable.
- You can use the BIN function in SAS/IML to divide data into bins based on custom cut points and unevenly spaced bins.
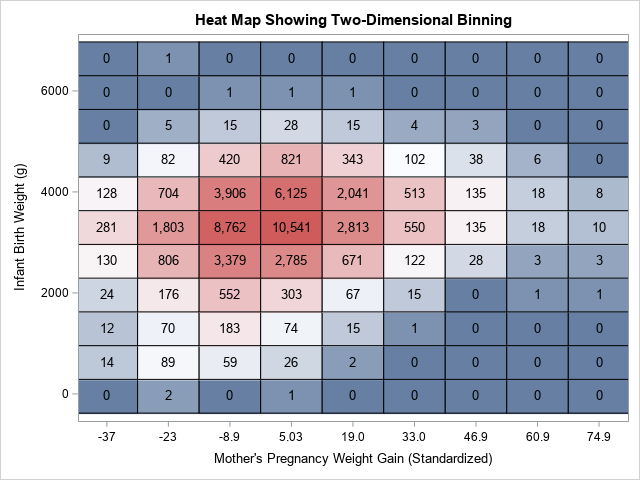
2-D binning and bivariate histograms in SAS
A histogram is a visualization of a univariate equal-width binning scheme. You can perform similar computations and visualizations for two-dimensional data. If your goal is to understand the density of continuous bivariate data, you might want to use a bivariate histogram rather than a scatter plot (which, for large samples, suffers from overplotting).
- The KDE procedure creates a basic bivariate histogram. You can also use the OUT= option to output the counts for each 2-D bin. You can then use PROC SGPLOT to visualize the bins. An example is shown at the top of this article.
- You can use SAS/IML to implement 2-D binning and visualize the bins by using a heat map or by overlaying bin counts on a scatter plot.
- You can use hexagonal bins rather than rectangular bins to create a hexagonal bin plot in SAS
- You can create a quantile bin plot, which divides a 2-D region into rectangles that contain approximately the same number of points.
In summary, this guide provides many links to programs and examples that bin data in SAS. Whether you want to use equal-width bins, quantile bins, or two-dimensional bins, hopefully, you will find an example to get you started. If I've missed an important topic, or if you have a favorite binning method that I have not covered, leave a comment.

3 Comments
Very nice article Rick, thank you!
Are there any procedures or recommended approaches for determining the optimal number of bins to maximize model performance?
Since you use the terms "optimal" and "model performance," I assume you are looking for a way to bin regressor variables to fit a binary target (response) variable. Do an internet search for "weight of evidence" (WOE). In SAS 9, the HPBIN procedure reports the weight-of-evidence. There is an example in the doc that explains how to interpret the results. In SAS Viya, you can use the BINNING procedure for weight-of-evidence computations.