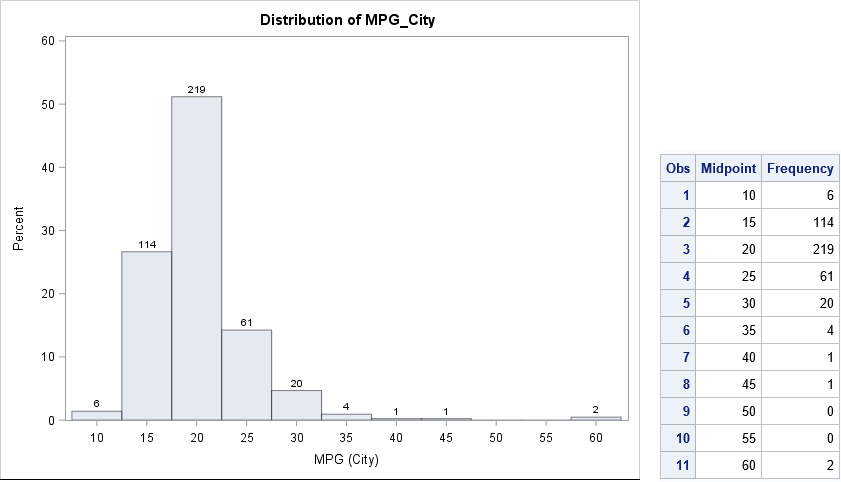
Recently a SAS programmer wanted to obtain a table of counts that was based on a histogram. I showed him how you can use the OUTHIST= option on the HISTOGRAM statement in PROC UNIVARIATE to obtain that information. For example, the following call to PROC UNIVARIATE creates a histogram for the MPG_City variable in the Sashelp.Cars data set. The histogram has 11 bins. The OUTHIST= option writes the counts for each bin to a SAS data set:
proc univariate data=Sashelp.Cars noprint; var MPG_City; histogram MPG_City / barlabel=count outhist=MidPtOut; run; proc print data=MidPtOut label; label _MIDPT_ = "Midpoint" _COUNT_="Frequency"; var _MIDPT_ _COUNT_; run; |
Endpoints versus midpoints
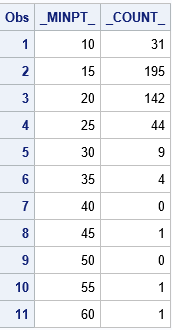
As I've previously discussed, PROC UNIVARIATE supports two options for specifying the locations of bins. The MIDPOINTS option specifies that "nice" numbers (for example, multiples of 2, 5, or 10) are used for the midpoints of the bins; the ENDPOINTS option specifies that nice numbers are used for the endpoints of the bins; By default, midpoints are used, as shown in the previous section. The following call to PROC UNIVARIATE uses the ENDPOINTS option and writes the new bin counts to a data set. The histogram is not shown.
proc univariate data=Sashelp.Cars noprint; var MPG_City; histogram MPG_City / barlabel=count endpoints outhist=EndPtOut; run; proc print data=EndPtOut; label _MINPT_ = "Left Endpoint" _COUNT_="Frequency"; var _MINPT_ _COUNT_; run; |
Tabulating counts in the SAS/IML language
If you want to "manually" count the number of observations in each bin, you have a few choices. If you already know the bin width and anchor position for the bins, then you can use a DATA step array to accumulate the counts. You can also use PROC FORMAT to define a format to bin the observations and use PROC FREQ to tabulate the counts.
The harder problem is when you do not have a prior set of "nice" values to use as the endpoints of bins. It is usually not satisfactory to use the minimum and maximum data values as endpoints of the binning intervals because that might result in intervals whose endpoints are long decimal values such as [3.4546667 4.0108333].
Fortunately, the SAS/IML language provides the GSCALE subroutine, which computes "nice" values from a vector of data and the number of bins. The GSCALE routine returns a three-element vector. The first element is the minimum value of the leftmost interval, the second element is the maximum value of the rightmost interval, and the third element is the bin width. For example, the following SAS/IML statements compute nice intervals for the data in the MPG_City variable:
proc iml; use Sashelp.Cars; read all var "MPG_City" into X; close; /* GSCALE subroutine computes "nice" tick values: s[1]<=min(x); s[2]>=max(x) */ call gscale(s, x, 10); /* ask for about 10 intervals */ print s[rowname={"Start" "Stop" "Increment"}]; |
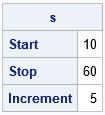
The output from the GSCALE subroutine suggests that a good set of intervals to use for binning the data are [10, 15), [15, 20), ..., [55, 60]. These are the same endpoints that are generated by using the ENDPOINTS option in PROC UNIVARIATE. (Actually, the procedure uses half-open intervals for all bins, so it adds the extra interval [60, 65) to the histogram.)
I've previously shown how to use the BIN and TABULATE functions in SAS/IML to count the observations in a set of bins. The following statements use the values from the GSCALE routine to form evenly spaced cutpoints for the binning:
cutPoints = do(s[1], s[2], s[3]); /* use "nice" cutpoints from GSCALE */ *cutPoints = do(s[1], s[2]+s[3], s[3]); /* ALTERNATIVE: add additional cutpoint to match UNIVARIATE */ b = bin(x, cutPoints); /* find bin for each obs */ call tabulate(bins, freq, b); /* count how many obs in each bin */ binLabels = char(cutPoints[bins]); /* use left endpoint as labels for bins */ print freq[colname = binLabels label="Count"]; |
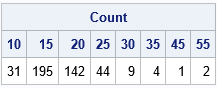
Except for the last interval, the counts are the same as for the ENDPOINTS option in PROC UNIVARIATE. It is a matter of personal preference whether you want to treat the last interval as a closed interval or whether you want all intervals to be half open. If you want to exactly match PROC UNIVARIATE, you can modify the definition of the cutPoints variable, as indicated in the program comments.
Notice that the TABULATE routine only reports the bins that have nonzero counts. If you prefer to obtain counts for ALL bins—even bins with zero counts—you can use the TabulateLevels module, which I described in a previous blog post.
In summary, you can use PROC UNIVARIATE or SAS/IML to create a tabular representation of a histogram. Both procedures provide a way to obtain "nice" values for the bin endpoints. If you already know the endpoints for the bins, you can use other techniques in SAS to produce the table.

1 Comment
Pingback: The essential guide to binning in SAS - The DO Loop