Video killed the radio star....
We can't rewind, we've gone too far.
-- The Buggles (1979)
"You kids have it easy," my father used to tell me. "When I was a kid, I didn't have all the conveniences you have today." He's right, and I could say the same thing to my kids, especially about today's handheld technology. In particular, I've noticed that powerful handheld technology (especially the modern calculator) has killed the standard probability tables that were once ubiquitous in introductory statistics textbooks.
In my first probability and statistics course, I constantly referenced the 23 statistical tables (which occupied 44 pages!) in the appendix of my undergraduate textbook. Any time I needed to compute a probability or test a hypothesis, I would flip to a table of probabilities for the normal, t, chi-square, or F distribution and use it to compute a probability (area) or quantile (critical value). If the value I needed wasn't tabulated, I had to manually perform linear interpolation from two tabulated values. I had no choice: my calculator did not have support for these advanced functions.
In contrast, kids today have it easy! When my son took AP statistics in high school, his handheld calculator (a TI-84, which costs about $100) could compute the PDF, CDF, and quantiles of all the important probability distributions. Consequently, his textbook did not include an appendix of statistical tables.
It makes sense that publishers would choose to omit these tables, just as my own high school textbooks excluded the trig and logarithm tables that were prevalent in my father's youth. When handheld technology can reproduce all the numbers in a table, why waste the ink and paper?
In fact, by using SAS software, you can generate and display a statistical table with only a few statements. To illustrate this, let's use SAS to generate two common statistical tables: a normal probability table and a table of critical values for the chi-square statistic.
A normal probability table
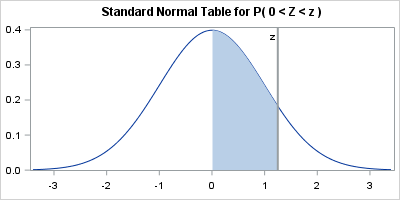
A normal probability table gives an area under the standard normal density curve. As discussed in a Wikipedia article about the standard normal table, there are three equivalent kinds of tables, but I will use SAS to produce the first table on the list. Given a standardized z-score, z > 0, the table gives the probability that a standard normal random variate is in the interval (0, z). That is, the table gives P(0 < Z < z) for a standard normal random variable Z. The graph below shows the shaded area that is given in the body of the table.
You can create the table by using the SAS DATA step, but I'll use SAS/IML software. The rows of the table indicate the z-score to the first decimal place. The columns of the table indicate the second decimal place of the z-score. The key to creating the table is to recall that you can call any Base SAS function from SAS/IML, and you can use vectors of parameters. In particular, the following statements use the EXPANDGRID function to generate all two-decimal z-scores in the range [0, 3.4]. The program then calls the CDF function to evaluate the probability P(Z < z) and subtracts 1/2 to obtain the probability P(0 < Z < z). The SHAPE function reshapes the vector of probabilities into a 10-column table. Finally, the PUTN function converts the column and row headers into character values that are printed at the top and side of the table.
proc iml; /* normal probability table similar to https://en.wikipedia.org/wiki/Standard_normal_table#Table_examples */ z1 = do(0, 3.4, 0.1); /* z-score to first decimal place */ z2 = do(0, 0.09, 0.01); /* second decimal place */ z = expandgrid(z1, z2)[,+]; /* sum of all pairs from of z1 and z2 values */ p = cdf("Normal", z) - 0.5; /* P( 0 < Z < z ) */ Prob = shape( p, ncol(z1) ); /* reshape into table with 10 columns */ z1Lab = putn(z1, "3.1"); /* formatted values of z1 for row headers */ z2Lab = putn(z2, "4.2"); /* formatted values of z2 for col headers */ print Prob[r=z1Lab c=z2Lab F=6.4 L="Standard Normal Table for P( 0 < Z < z )"]; |
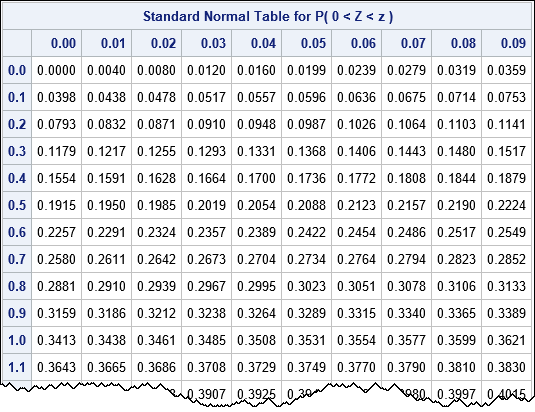
To find the probability between 0 and z=0.67, find the row for z=0.6 and then move over to the column labeled 0.07. The value of that cell is P(0 < Z < 0.67) = 0.2486.
Chi-square table of critical values
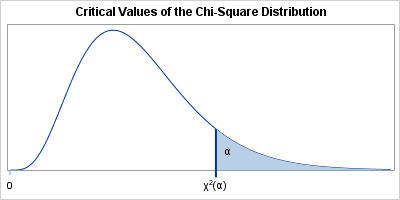
Some statistical tables display critical values for a test statistic instead of probabilities. This section shows how to construct a table of the critical values of a chi-square test statistic for common significance levels (α). The rows of the table correspond to degrees of freedom; the columns correspond to significance levels. The following graph shows the situation. The shaded area corresponds to significance levels.
The corresponding table provides the quantile of the distribution that corresponds to each significance level. Again, you can use the DATA step, but I have chosen to use SAS/IML software to generate the table:
/* table of critical values for the chi-square distribution https://flylib.com/books/3/287/1/html/2/images/xatab02.jpg */ df = (1:30) || do(40,100,10); /* degrees of freedom */ /* significance levels for common one- or two-sided tests */ alpha = {0.99 0.975 0.95 0.9 0.1 0.05 0.025 0.01}; g = expandgrid(df, alpha); /* all pairs of (df, alpha) values */ p = quantile("ChiSquare", 1 - g[,2], g[,1]); /* compute quantiles for (df, 1-alpha) */ CriticalValues = shape( p, ncol(df) ); /* reshape into table */ dfLab = putn(df, "3."); /* formatted row headers */ pLab = putn(alpha, "5.3"); /* formatted col headers */ print CriticalValues[rowname=dfLab colname=pLab F=6.3 L="Critical Values of Chi-Square Distribution"]; |
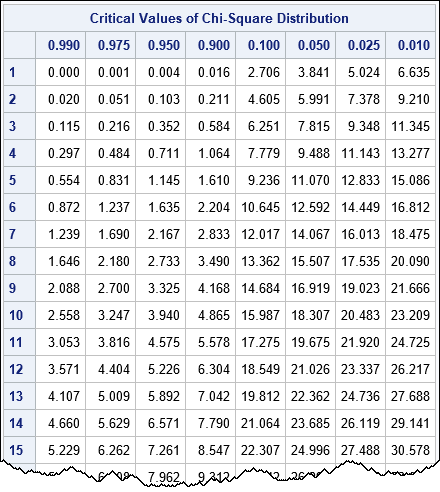
To illustrate how to use the table, suppose that you have computed a chi-square test statistic for 9 degrees of freedom. You want to determine if you should reject the (one-sided) null hypothesis at the α = 0.05 significance level. You trace down the table to the row for df=9 and then trace over to the column for 0.05. The value in that cell is 16.919, so you would reject the null hypothesis if your test statistic exceeds that critical value.
Just as digital downloads of songs have supplanted records and CDs, so, too, have modern handheld calculators replaced the statistical tables that used to feature prominently in introductory statistics courses. However, if you ever feel nostalgic for the days of yore, you can easily resurrect your favorite table by writing a few lines of SAS code. To be sure, there are some advanced tables (the Kolmogorov-Smirnov test comes to mind) that have not yet been replaced by a calculator key, but the simple tables are dead. Killed by the calculator.
It might be bad luck to speak ill of the dead, but I say, "good riddance"; I never liked using those tables anyway. What are your thoughts? If you are old enough to remember tables do you have fond memories of using them? If you learned statistics recently, are you surprised that tables were once so prevalent? Share your experiences by leaving a comment.

18 Comments
Nice post, that brings back some memories!
My daughter also took AP Stats and did learn how to use these statistical tables, maybe just to impart some appreciation for the process of her forebears. But in most homework and tests, the TI-84 did the trick.
I remember the tables, I used the tables, and I do not miss them one bit.
I must be older than you. I had to use trig tables and log tables in high school and do linear interpolation (sometimes in two dimensions). Our trig teacher would ban calculators for some quizzes and tests. (And he was a curmudgeon who complained about people relying on calculators like the TI-30 with the LED screen that many of us had.)
I think it was useful to learn how to use tables like the ones above.
They give another view of the data.
From the Simon Rich story “I still remember the day I got my first calculator" in his book "Ant Farm" ...
Teacher: All right, children, welcome to fourth grade math. Everyone take a calculator out of the bin.
Me: What are these?
Teacher: From now on we'll be using calculators.
Me: What do these things do?
Teacher: Simple operations, like multiplication and division.
Me: You mean this device just...does them? By itself?
Teacher: Yes. You enter in the problem and press equal.
Me: You...you knew about this machine all along, didn't you? This whole time, while we were going through this...this charade with the pencils and the line paper and the stupid multiplication tables!...I'm sorry for shouting...It's just...I'm a little blown away.
Hysterical! As a former math professor, I have to confess that we STILL teach "the long way" of doing calculations and then introduce shortcuts. For example, in calculus the derivative is defined as the limit of a difference quotient. We then spend weeks deriving shortcuts that enable you to quickly compute the derivative of polynomials, trig functions, etc. By the time it is over, most students have long-forgotten the limit definition.
I find an occasional need to have "Statistical Tables and Formulae" by Kokoska and Nevison within reach, though perhaps to have a comprehensive macro at hand for SAS to generate them with a few keystrokes could be a handy tool.
Thanks! Before I bother SAS Support (!) is it obvious what is the matter here?
5 proc iml;
NOTE: IML Ready
6 /* normal probability table similar to
7 https://en.wikipedia.org/wiki/Standard_normal_table#Table_examples */
8 z1 = do(, 3.4, 0.1);
ERROR: Mandatory argument skipped for function DO.
Yes, you skipped the first argument to the DO function. It should be
z1 = do(0, 3.4, 0.1);
Thanks for the #MondayMemory post and neat IML code.
Oooohhhh fond memories using the Statistics tables... I remember having them printed on bright yellow thick paper and proudly using them. Got a bit worn after a few years!
Well, isn't THAT cheery!
You can also do this as a one-liner in PROC OPTMODEL:
proc optmodel;
print {i in 0..3.4 by 0.1, j in 0..0.09 by 0.01} (cdf("Normal", i+j) - 0.5) 6.4;
quit;
"I'll give you my sliderule/log table when you pry it from my cold, dead hands"
My Dad used to say the same thing: "You kids have computers today for everything". My Dad never had to take beginning FORTRAN programming from Prof Roberson.
I looked in my cupboard: my book of tables is still there. One I have at home includes graphics similar to those you published. Why don't computers produce more graphics? They still seem to work like tables: give me a number. Why not show a probability cloud? Instead of a 95% confidence interval (why not 92%) show a probability gradient. Computers could do this. Tables never could.
I'm not sure that using a calculator for statistics is necessarily easier than a book of tables, because statistical functions typically require processing more than one number at once. On a calculator that results in having to navigate menus, or entering a one-line program, not much better than using R, for example. For these reasons calculators can't speed things up in the same way as they did over the use of log and trig tables, or slide rules for that matter.
Possibly a calculator designed especially for statisticians could speed things up. But I would hang on your statistical tables for now.
I myself favour those by Henry Neave (an Open University set boook once), Lindley and Scott (often issued to examination candidates) or F.C. Powell (recommended by a lecturer as comprehensive), and no doubt people might have own favourites. By all means tell us, and why!
Thanks for writing. It is always good to listen to those who have different opinions and experiences.