You've probably heard about the "80-20 Rule," which describes many natural and manmade phenomena. This rule is sometimes called the "Pareto Principle" because it was discovered by Vilfredo Pareto (1848–1923) who used it to describe the unequal distribution of wealth. Specifically, in his study, 80% of the wealth was held by 20% of the population. The unequal distribution of effort, resources, and other quantities can often be described in terms of the Pareto distribution, which has a parameter that controls the inequity. Whereas some data seem to obey an 80-20 rule, other data are better described as following a "70-30 rule" or a "60-40 rule," and so on. (Although the two numbers do not need to add to 100, it makes the statement pleasingly symmetric.)
I thought about the Pareto distribution recently when I was looking at some statistics for the SAS blogs. I found myself wondering whether 80% of the traffic to a blog is generated by 20% of its posts. (Definition: A blog is a collection of articles. Each individual article is a post.) As you can imagine, some posts are more popular than others. Some posts are timeless. They appear in internet searches when someone searches for a particular statistical or programming technique, even though they were published long ago. Other posts (such as Christmas-themed posts) do not get much traffic from internet searches. They generate traffic for a week or two and then fade into oblivion.
To better understand how various blogs at SAS follow the Pareto Principle, I downloaded data for seven blogs during a particular time period. I then kept only the top 100 posts for each blog.
The following line plot shows the pageviews for one blog. The horizontal axis indicates the posts for this blog, ranked by popularity. (The most popular post is 1, the next most popular post is 2, and so forth.) This blog has four very popular posts that each generated more than 7,000 pageviews during the time period. Another group of four posts were slightly less popular (between 4,000 and 5,000 pageviews). After those eight "blockbuster" posts are the rank-and-file posts that were viewed less than 3,000 times during the time period.
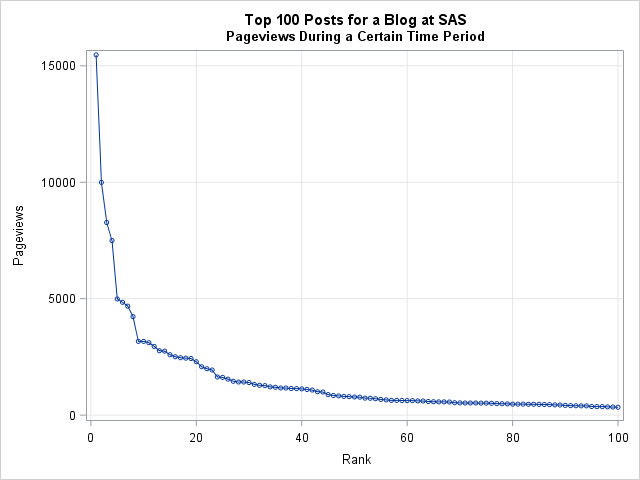
The pageviews for the other blogs look similar. This distribution is also common in book-sales data: most books sell only a few thousand copies whereas the best-sellers (think John Grisham) sell hundreds of millions of copies. Movie revenue is another example that follows this distribution.
The distribution is a long-tailed distribution, a fact that becomes evident if you graph a histogram of the underlying quantity. For the blog, the following histogram shows the distribution of the pageviews for the top 100 posts:
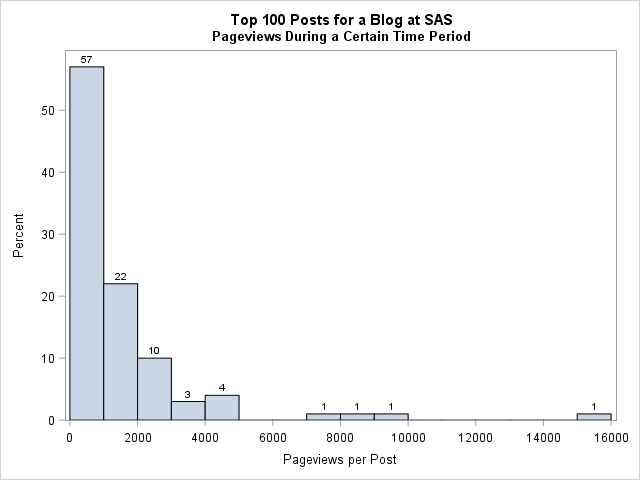
Notice the "power law" nature of the distribution for the first few bars of the histogram. The height of each bar is about 0.4 of the previous height. About 57% of the blog posts had less than 1,000 pageviews. Another 22% had between 1,000 and 2,000 pageviews. The number of rank-and-file posts in each category decreases like a power law, but then the blockbuster posts start to appear. These popular posts give the distribution a very long tail.
Because some blogs (like the one pictured) attract thousands of readers whereas other blogs have fewer readers, you need to standardize the data if you want to compare the distributions for several blogs. Recall that the Pareto Principle is a statement about cumulative percentages. The following graph shows the cumulative percentages of pageviews for seven blogs at SAS (based on the Top 100 posts):
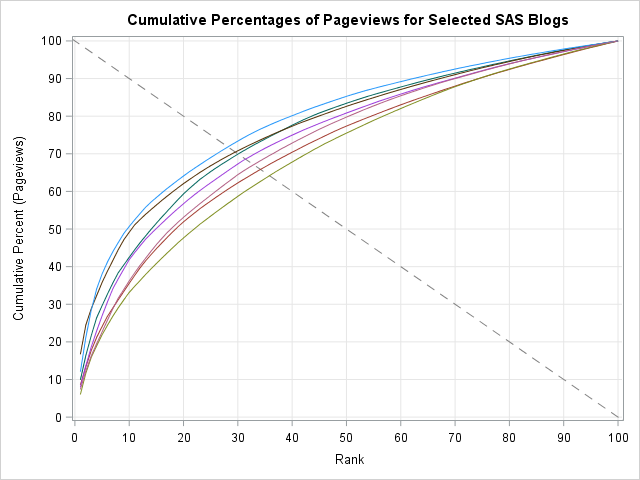
The graph shows a dashed line with slope –1 that is overlaid on the cumulative percentage curves. The places where the dashed line intersects a curve are the "Pareto locations" for which Y% of the pageviews are generated by the first (1-Y)% most popular blog posts. In general, these blogs appear to satisfy a "70-30 rule" because about 70% of the pageviews are generated by the 30 / 100 most popular posts. There is some variation between blogs, with the upper curve following a "72-28 rule" and the lower curve satisfying a "63-37 rule."
All this is approximate and is based on only the top 100 posts for each blog. For a more rigorous analysis, you could use PROC UNIVARIATE or PROC NLMIXED to fit the parameters of the Pareto distribution to the data for each blog. However, I am happy to stop here. In general, blogs at SAS satisfy an approximate "70-30 rule," where 70% of the traffic is generated by the top 30% of the posts.

4 Comments
Interesting. We'll have to try it on our company intranet blogs. We're struggling to get the hit rate up.
.
There may be a confounding factor here. I subscribe to this blog and a few others, including Graphically Speaking. The Do Loop arrives complete in the mail, so I often read it there. Graphically Speaking comes as an introductory paragraph only, so I must link to the web site to read further. The web site hit data would not relate to my interest level. Can you distinguish blogs with these two types of subscription messages?
Subscriptions are not included in these numbers. By default, subscribers to SAS blogs get an introductory paragraph. However, I have readers in China who told me privately that they are unable to access the SAS blogs web page because of internet censorship. I now send my the entire blog post to subscribers so that all people can access my content via email. Yes, this cuts down on my pageviews, but my goal is to share information, not to rack up the most pageviews.
Very interesting and insightful article, Rick! Its an interesting question on whether, and how, this data changes behaviors. If you give the public more of what they're interested in, does the Pareto rule shift itself again within sub-topics? Does an oversaturation of blockbuster topics lead to more consistent read rates or reader fatigue?
Thanks for writing. Journalists certainly wrestle with these questions. Some magazines and tabloids revisit popular topics often. For example, cover articles about the Royal Family and certain popular celebrities help to sell magazines.
Personally, I get bored reading about the same topic unless there is new information to be learned. As a writer, I do not revisit a topic solely because it is popular. I want to be able to say something new before I revisit a topic.