In a previous article, I showed how to use SAS to perform mean imputation. However, there are three problems with using mean-imputed variables in statistical analyses:
- Mean imputation reduces the variance of the imputed variables.
- Mean imputation shrinks standard errors, which invalidates most hypothesis tests and the calculation of confidence interval.
- Mean imputation does not preserve relationships between variables such as correlations.
This article explores these issues in more detail. The example data set (called IMPUTED) was created in the previous article. It is a modification of the Sashelp.Class data in which heights of seven students are assigned missing value. Mean imputation replaces those seven value with the mean of the observed values. The Orig_Height variable contains the original (missing) values; the Height variable contains the imputed values.
Mean imputation reduces variance
The following call to PROC MEANS computes simple descriptive statistics for the original and imputed variables. The statistics for the original variable are computed by using listwise deletion, which means that missing observations are dropped from the analysis.
proc means data=Imputed ndec=2 N NMiss Mean StdErr StdDev; var Orig_Height Height; /* compare stats original and imputed vars */ run; |
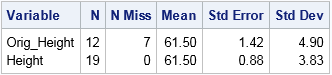
The mean-imputed variable (Height) has the same mean as the original variable (Orig_Height). This is always the case for mean-imputed data. However, notice that the standard deviation (hence, variance) of the imputed variable is smaller. You can see this by overlaying the distributions of the original and imputed variables, as follows:
title "Comparison of Original and Imputed Data"; proc sgplot data=Imputed; xaxis label="Height" values=(52 to 70 by 4 61.5) valueshint; yaxis grid; histogram Height / scale=count binstart=52 binwidth=4 legendlabel="Imputed"; histogram Orig_Height / scale=count binstart=52 binwidth=4 legendlabel="Original" transparency=0.5; refline 61.5 / axis=x lineattrs=(color=black) label="Mean"; /* mean value */ run; |
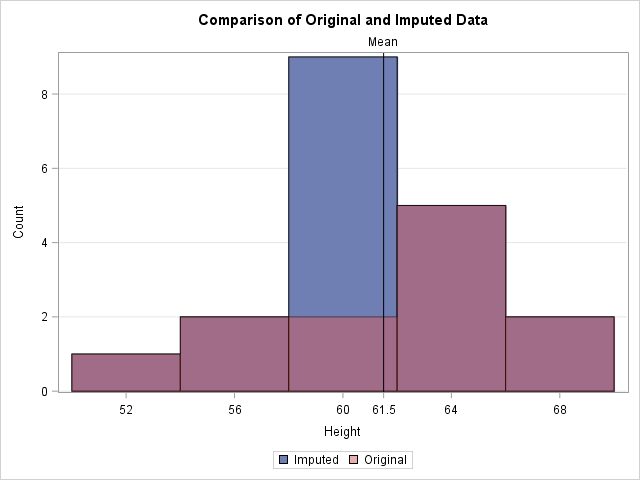
In the graph, the reddish bars show the distribution of the observed values. Behind those bars is a second histogram (in blue) that shows the distribution of the imputed data. The only bar of the second histogram that is visible is the one that contains the sample mean. The graph emphasizes the fact that all imputed values are equal to the mean. This reduces the variance of the imputed variable because none of the imputed values contribute to the variance (which is based on deviations from the mean). Thus the variance of the mean-imputed variable is always smaller than the variance of the original variable.
Mean imputation shrinks standard errors and confidence intervals
The previous section shows that the imputed variable always has a smaller variance than original variable. The estimated variance is used to compute many other statistics, which are also shrunk. For example, the following statistics are shrunk for the imputed variable as compared to the original variable:
- The standard error of the mean, as shown in the previous output from PROC MEANS.
- The confidence intervals that are based on mean-imputed data will be shorter.
- The standard t test for a mean uses the standard error to compute a p-value for the null hypothesis that the population mean equals some value. If the standard error is shrunk by mean imputation, then the standard one-sample t test is not valid and the p-value is too small. You will potentially reject a null hypotheses that might be true (a Type I error).
Mean imputation distorts relationships between variables
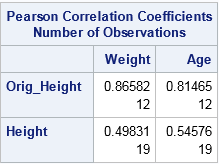
The previous sections emphasized how mean imputation affects univariate statistics. But mean imputation also distorts multivariate relationships and affects statistics such as correlation. For example, the following call to PROC CORR computes the correlation between the Orig_Height variable and the Weight and Age variables. It also computes the correlations for the mean-imputed variable (Height). The output shows that the imputed variable has much smaller correlations with Weight and Age because single imputation does not try to preserve multivariate relationships.
proc corr data=Imputed noprob; var Weight Age; with Orig_Height Height; run; |
In a similar way, a linear regression that attempts to predict Weight by height is corrupted by the replacement of missing values with mean values. For one-variable linear regression, it is easy to show that the estimates of the slope are unchanged by mean imputation, but the intercept estimates can be different. For these data, the least-squares estimate of the slope is 2.96. The intercept estimate for the original data is -90 whereas the intercept for the imputed variable is -82. The following call to PROC SGPLOT shows these estimates graphically:
ods graphics / attrpriority=NONE; title "Simple Linear Regression with Mean Imputation"; proc sgplot data=Imputed; styleattrs datasymbols=(Circle X); reg x=Orig_Height y=Weight / nomarkers curvelabel="Original"; reg x=Height y=Weight / nomarkers curvelabel="Imputed"; scatter x=Height y=Weight / group=Replaced; xaxis grid; yaxis grid; run; |
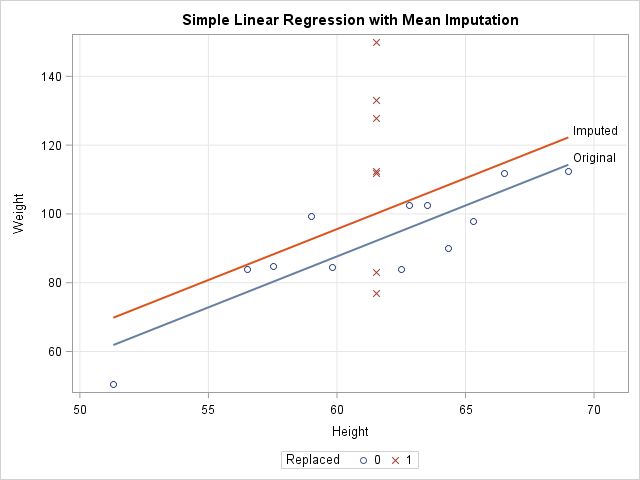
The graph shows that the model that uses the original data (the blue line) predicts lower values of Weight than the model that uses the imputed heights (the red line). The scatter plot shows why. The model for the original data uses only 12 observations, which are displayed as blue circles. The predicted value of Weight for the mean height is about 92. The seven imputed values are shown as red X's for which the Height is 61.5. The average Weight for these observations is greater than 92, so the seven observations bias the computation and "pull up" the regression line. For different data, the imputed model might "pull down" the predictions. It depends on the average response for the imputed observations.
You can download the SAS program that computes all the tables and figures in this article.
Conclusions
Although imputing missing values by using the mean is a popular imputation technique, there are serious problems with mean imputation. The variance of a mean-imputed variable is always biased downward from the variance of the un-imputed variable. This bias affects standard errors, confidence intervals, and other inferential statistics. Experts agree that mean imputation should be avoided when possible (Allison (2009), Horton and Kleinman (2007)).
So what alternatives are there? That question has been the topic of many books and papers. Paul Allison (2009) suggests either maximum likelihood estimation or multiple imputation methods, both of which try to preserve relationships between variables and the inherent variability of the data. In SAS, PROC MI and MIANALYZE work with other SAS/STAT procedures to apply these methods to missing data. You can see the list of procedures that handle missing data in SAS. For more information about the alternatives to single imputation, the following references are good places to start:
- Allison, P. (2009) "Missing Data." Chapter downloaded from Statistical Horizons website on 26NOV2017.
- Berglund, P. and Heeringa, S. (2014) Multiple Imputation of Missing Data Using SAS
- Horton, N. and Kleinman, K. (2007) "Much ado about nothing: A comparison of missing data methods and software to fit incomplete data regression models," The American Statistician

1 Comment
Pingback: Mean imputation in SAS - The DO Loop