Correlations between variables are typically displayed in a matrix. Because the correlation matrix is determined by the order of the variables, it is difficult to find the largest and smallest correlations, which is why analysts sometimes use colors to visualize the correlation matrix. Another visualization option is the pairwise correlation plot, which orders pairs of variables by their correlations.
Neither graph addresses a related problem: for each variable, which other variables are strongly correlated with it? Which are weakly correlated? In SAS, the CORR procedure supports a little-known option that answers that question. You can use the RANK option in the PROC CORR statement to order the correlations for each variable (independently) according to the magnitude of the correlations.
Notice that the RANK option does not compute "rank correlation." You can compute rank correlation by using the SPEARMAN option.
Ordering correlations by size
Consider the Sashelp.Heart data set, which contains data for 5209 patients who enrolled in the Framingham Heart Study. You might want to know which variables are highly correlated with weight, or smoking, or blood pressure, to name a few examples. The following call to PROC CORR uses the RANK option to order each row of correlations in the output:
/* Note: The MRW variable is similar to the body-mass index (BMI). */ proc corr data=sashelp.Heart RANK noprob; var Height Weight MRW Smoking Diastolic Systolic Cholesterol; run; |
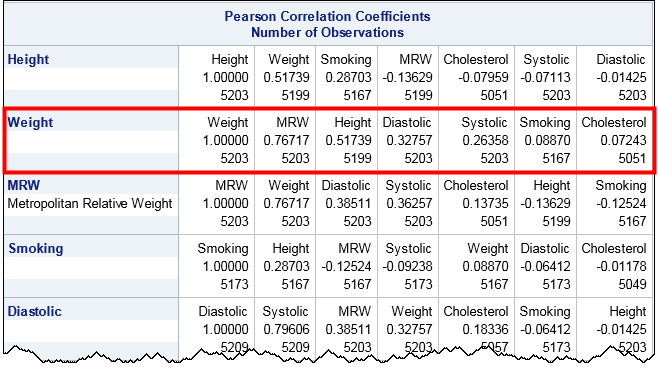
The output orders each row according to the magnitude of the correlations. (Click to enlarge.) For example, look at the row for the Weight variable, which is highlighted by a red rectangle. Scanning across the row, you can see that the variables that are the most strongly correlated with Weight are MRW (which measures whether a patient is overweight) and the height. At the end of the row are the variables that are essentially uncorrelated with Weight, namely Smoking and Cholesterol. The numbers at the bottom of each cell indicate the number of nonmissing pairwise observations.
In a similar way, look at the row for the Smoking variable. That variable is most strongly correlated with Height and MRW. Notice that the correlation with MRW is negative, which shows that the correlations are ordered by absolute values (magnitude). The highly correlated variables—whether positively or negatively correlated—appear first and the uncorrelated variable (correlations near zero) occur last in each row.
Ordering correlations for groups of variables
It is common to want to examine the correlations between groups of variables. For example, a clinician might want to look at the correlations between clinical measurements (blood pressure, cholesterol,...) and genetic or lifestyle choices (weight, smoking habits,...). The following call to PROC CORR uses the VAR and WITH statements to compare groups of variables, and uses the RANK option to order the correlations along each row:
proc corr data=sashelp.Heart RANK noprob; var Height Weight MRW Smoking; /* genetic and lifestyle factors */ with Diastolic Systolic Cholesterol; /* clinical measurements */ run; |
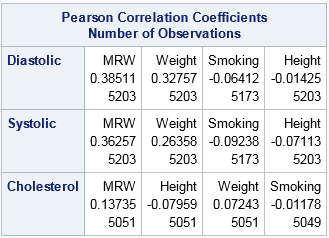
Notice that the number of variables in the VAR statement determine the columns. The variables in the WITH statement determine the rows. Within each row, the variables in the VAR statement are ordered by the magnitude of the correlation. For these data, the Diastolic and Systolic variables are similar with respect to how they correlate with the column variables. The order of the column variables is the same for the first two rows. In contrast, the strength of the correlations between the Cholesterol variable and the column variables are in a different order.
In summary, you can use the RANK option in the PROC CORR statement to order the rows of a correlation matrix according to the magnitude (absolute value) of the correlations between each variable and the others. This makes it easy to find pairs of variables that are strongly correlated and pairs that are weakly correlated.

1 Comment
Nice article, Thanks a lot. Please keep posting about SAS statistics