How can you specify weights for a statistical analysis? Hmmm, that's a "weighty" question! Many people on discussion forums ask "What is a weight variable?" and "How do you choose a weight for each observation?" This article gives a brief overview of weight variables in statistics and includes examples of how weights are used in SAS.
Different kinds of weight variables
One source of confusion is that different areas of statistics use weights in different ways. All weights are not created equal! The weights in survey statistics have a different interpretation from the weights in a weighted least squares regression.
Let's start with a basic definition. A weight variable provides a value (the weight) for each observation in a data set. The i_th weight value, wi, is the weight for the i_th observation. For most applications, a valid weight is nonnegative. A zero weight usually means that you want to exclude the observation from the analysis. Observations that have relatively large weights have more influence in the analysis than observations that have smaller weights. An unweighted analysis is the same as a weighted analysis in which all weights are 1.
There are several kinds of weight variables in statistics. At the 2007 Joint Statistical Meetings in Denver, I discussed weighted statistical graphics for two kinds of statistical weights: survey weights and regression weights. An audience member informed me that STATA software provides four definitions of weight variables, as follows:
- Frequency weights: A frequency variable specifies that each observation is repeated multiple times. Each frequency value is a nonnegative integer.
- Survey weights: Survey weights (also called sampling weights or probability weights) indicate that an observation in a survey represents a certain number of people in a finite population. Survey weights are often the reciprocals of the selection probabilities for the survey design.
- Analytical weights: An analytical weight (sometimes called an inverse variance weight or a regression weight) specifies that the i_th observation comes from a sub-population with variance σ2/wi, where σ2 is a common variance and wi is the weight of the i_th observation. These weights are used in multivariate statistics and in a meta-analyses where each "observation" is actually the mean of a sample.
- Importance weights: According to a STATA developer, an "importance weight" is a STATA-specific term that is intended "for programmers, not data analysts." The developer says that the formulas "may have no statistical validity" but can be useful as a programming convenience. Although I have never used STATA, I imagine that a primary use is to downweight the influence of outliers. The REWEIGHT statement in PROC REG served a similar purpose in the years before robust regression methods were implemented in SAS.
Frequencies are not weights
I have previously argued that a frequency variable is not a weight variable. I provided an example that shows the distinction between a frequency variable and a weight variable in regression. Briefly, a frequency variable is a notational convenience that enables you to compactly represent the data. A frequency variable determines the sample size (and the degrees of freedom), but using a frequency variable is always equivalent to "expanding" the data set. (To expand the data, create fi identical observations when the i_th value of the frequency variable is fi.) An analysis of the expanded data is identical to the same analysis on the original data that uses a frequency variable.
In SAS, the FREQ statement enables you to specify a frequency variable in most procedures. Ironically, in PROC FREQ you use the WEIGHT statement to specify frequencies. Because weights can be non-integer,the WEIGHT statement enables you to analyze tables that contain expected counts, percentages, and other non-integer values.
Have survey data? Use survey weights
If you have survey data, you should analyze it by using survey weights. The sum of the survey weights equals the population size. Using survey weights enables you to make correct inferences about the finite population that is represented by the survey.
In SAS, you can use the SAS SURVEY procedures to analyze survey data. The SURVEY procedures (including SURVEYMEANS, SURVEYFREQ, and SURVEYREG) also support stratified samples and strata weights.
Inverse variance weights
Inverse variance weights are appropriate for regression and other multivariate analyses. When you include a weight variable in a multivariate analysis, the crossproduct matrix is computed as X`WX, where W is the diagonal matrix of weights and X is the data matrix (possibly centered or standardized). In these analyses, the weight of an observation is assumed to be inversely proportional to the variance of the subpopulation from which that observation was sampled. You can "manually" reproduce a lot of formulas for weighted multivariate statistics by multiplying each row of the data matrix (and the response vector) by the square root of the appropriate weight.
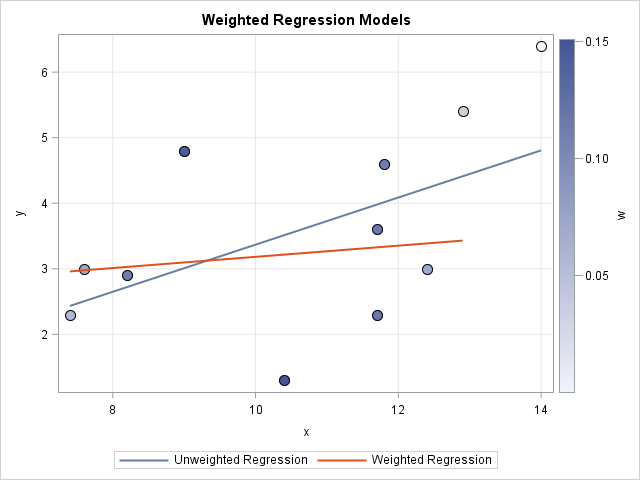
In particular, if you use a weight variable in a regression procedure, you get a weighted regression analysis. For regression, the right side of the normal equations is X`WY.
You can also use weights to analyze a set of means, such as you might encounter in meta-analysis or an analysis of means. The weight that you specify for the i_th mean should be inversely proportional to the variance of the i_th sample. Equivalently, the weight for the i_th group is (approximately) proportional to the sample size of the i_th group.
In SAS, most regression procedures support WEIGHT statements. For example, PROC REG performs a weighted least squares regression. The multivariate analysis procedures (DISRIM, FACTOR, PRINCOMP, ...) use weights to form a weighted covariance or correlation matrix. You can use PROC GLM to compute a meta-analyze of data that are the means from previous studies.
What happens if you "make up" a weight variable?
Analysts can (and do!) create weights arbitrarily based on "gut feelings." You might say, "I don't trust the value of this observation, so I'm going to downweight it." Suppose you assign Observation 1 twice as much weight as Observation 2 because you feel that Observation 1 is twice as "trustworthy." How does a multivariate procedure interpret those weights?
In statistics, precision is the inverse of the variance. When you use those weights you are implicitly stating that you believe that Observation 2 is from a population whose variance is twice as large as the population variance for Observation 1. In other words, "less trust" means that you have less faith in the precision of the measurement for Observation 2 and more faith in the precision of Observation 1.
Examples of weighted analyses in SAS
In SAS, many procedures support a WEIGHT statement. The documentation for the procedure describes how the procedure incorporates weights. In addition to the previously mentioned procedures, many Base SAS procedures compute weighted descriptive statistics. For some examples of weighted statistical analyses in SAS and how to interpret the results, see the following articles:
- How to compute and interpret a weighted mean
- How to compute and interpret weighted quantiles or weighted percentiles
- How to compute and visualize a weighted linear regression
- Create and interpret a weighted histogram
WANT MORE GREAT INSIGHTS MONTHLY? | SUBSCRIBE TO THE SAS TECH REPORT

61 Comments
Hi Rick. Nice blog! It takes me back to discussions in graduate school. You ask, what happens when you make up weights? Analysts *ALWAYS* make up weights. One of my graduate school professors was fond of saying: "All analyses are weighted; some analyses use equal weights." This still sticks with me 30+ years later. If your barrier to doing a weighted analysis is: how do I choose the weights? You do not get out of the decision by using equal weights. Equal weights are convenient, and they are the default, but you are making an arbitrary choice when you choose to use equal weights. Embrace the WEIGHT statement!
Thanks for your thoughts. Another way to think about it is that equal weights are an assumption, but one that is reasonable in many circumstances. If you believe that all observations come from the same population, then it is reasonable to assume equal weights. The WEIGHT statement enables you to relax that assumption.
Hi
When I assign weights why do my sample gets reduced?
Sorry, but I do not understand your question. If you use positive weights, the sample size will not change. Observations for which weights are missing or nonpositive will be excluded from the analysis. If that is not clear, please post data and an example program to the SAS Support Communities.
the sample gets reduced if the weight variable frequency is not upto the correct places of decimal. Suppose after weighting weight factor is coming as 7.8890543, but you have taken it as 7.9 only then definitely base will reduce. Can you try using this method and let me know if any doubts
Hi Rick,
Do you happen to know any specific techniques I could use to create weights for my data? I am looking to rank order my data based upon a few variables but I would like to assign weights to these variables before i do that.
This article is about weights for observations. You are asking about weights for variables. If you have a target variable, you can use regression techniques to assign weights (parameter estimates) for the explanatory variables. If you don't have a target variable, then principal components are another way to obtain weights for variables. The first principal component is the linear combination (=weighted combination) of the variables that explain the most variance in the data.
Hey Rick,
I'm working on a small investment side project that involves selective arbitrage (investing in x amount of X outcomes). Currently, I do not apply any weights to my investment distributions, and, therefore, have an equal ROI for each investment. To maximize returns, I'd like to use historical data on these investments to weight the capital distribution, however, I am unsure how to calculate the weights.
The data consists of historical probabilities and the year in which the investment was executed.
Do you recommend a direction in which I go in, another resource to read, or ideas on where to start?
Any help would be greatly appreciated.
Matt
Yes, do an internet search for
"efficient frontier" portfolio
The efficient frontier is the weights that you should use to maximize your return while minimizing the risk.
Thanks for the quick response, Rick!
Appreciate the help.
Rick,
What regression techniques would you recommend when assigning weights to a variable that has 2 conditions: present or absent?
Thank you for your help.
Your question is somewhat vague. Perhaps you mean that you have a binary response variable (present or absent) and you want to fit a model to predict the probability of the feature being present. Statisticians often use logistic models for that purpose, and you can use weights in a logistic model. I suggest that you post your question with sample data to the SAS Support Community for additional advice.
logistic regression maybe
For logistic regression (or any generalized linear regression model), the same math applies for predicted values on the linear scale. These predicted values are then transformed by the inverse link function to get predicted values on the data scale. For a discussion of the "linear scale" and "data scale" and the inverse link function, see "Predicted values in generalized linear models: The ILINK option in SAS."
I am developing an Index of performance and i have already selected the parameters i am going to include in the index. Now the question is how to assign weights to those parameters? Please help
That is up to you. The S&P 500 is weighted by market capitalization. The Dow 30 index is a price-weighted index. Talk to your advisor/mentor/colleagues to determine the best way to weight the components in your index.
Hi,
I have time series for 3 variables. I have check their dependency and found that their dependency is not ignorable. They must be summed with their own weights to make a new variable. I have also a benchmark to evaluate this new variable. The problem is that I don't know how to define the proper weights to sum those 3 variables. I really appreciate any help.
I suggest you ask your question on CrossValidated.
Any suggestions on a methodology for weighting variables in a customer satisfaction survey? We would like to model our survey off the American Customer Satisfaction Index (ACSI) which uses the ACSI structural equation model: (((X1*W1)+(X2*W2)+(X3*W3))-1)/9*100
We operate a community service project providing IT skills coaching to local adults. Our CS survey asks three questions, Quality of Customer Service?, Knowledge of Customer Service Rep? and Confidence in Skills learned?
My understanding is that the weights should be published for each year. Do an internet search for
weights in acsi survey 2018
If I have a survey, and I have the 'survey weights', and now I use these to 'expand the data' to the population, what is your position on statistical inference in such situations? I am assuming that because we have expanded to the population, that any measures of association (correlations, ORs, etc.) or regression model estimates (betas) have no variation and thus inference is out of the question.
Thanks
You should ask questions like this on a statistical discussion forum. Remember that there is uncertainty in the estimates from the survey.
Hi Rick,
If I have "made up" weights about the level of importance that individual variables contribute to the processes I'm modeling, how do I go about assigning these weights to my variables? E.g. say I want to assign 30% to Var A, 15% to B, 15% to C, AND 40% to D. The variables in question are a combination of indices and rates. This is a study of different socioeconomic factors on neighborhood change. Thank you.
This article is about weights for observations. Your question is about weights for variables. In a regression context, the variable "weights" (coefficients) are determined by fitting the response variable. You don't get to choose the weights; the data assigns the variable weights.
If you insist that the variables are related by your made-up coefficients, consider creating a linear combination of the variables. You could center and standardize the variables (use PROC STDIZE) and form a new variable
W = 0.3*A_Std + 0.15*B_Std + 0.15*C_Std + 0.4*D_Std
where the "_Std" suffix indicates that the variables have been standardized. If you use W instead of (A,B,C,D) in the regression, then the original variables will have the relative influence that you have assigned.
Hi Rick,
I am currently using a similar setup for proc logistic, wherein I have to put a constraint on the variables such that one variable has 40% weight in the overall model. I hence used a new variable W=0.4*A_STD+ 0.6*B_STD. However, there are 10 variables, so should I create 10 new variables such that W1=0.4*A_STD+0.6*B_STD. W2=0.4*A_STD+0.6*C_STD, and so on till W10? Also, Why we standardize the data and how should we interpret the coefficients for these new variables. Furthermore, how we define the weights for the logistic regression, the coefficients are not really the weight, I believe.
I think you are confused. This article is about how to use ONE weight variable in order to assign different weights to each observation in a data set. I do not know how to make sense of the question you asked.
HI Rick,
Really appreciate the extremely prompt response. Let me rephrase my question. I know this blog was more about the observation weights, and my question is more about relative importance of each of the explanatory variable in the logistic regression. I could not find any other discussion point on this specific topic, and hence asked here itself.
I am building a scorecard model using logit approach with default flag ( takes value 0 or 1) as dependent variable, and there are 10 independent variables which are a mix of continuous and discrete. Business has asked us to fix the weight/contribution of one type(e.g financial factors) of variables at 40% of the total score. Below are the questions where I am struggling at:
1. How to calculate the weight of each of the variable in proc logistic. I think weight can be calculated after the score alignment in line with the scorecard methodology. Weight parameter in proc logistic put the weights on the observation and not on the variables.
2. How to put the constraint on the variables/coefficients to fix the weight of one or many variables.
You can ask questions about statistics and SAS programming at the SAS Support Communities.
I am using propensity score methods. I calculated propensity score first and then calculated weight using PS. I calculated weight 3 different ways: inverse of PS for all subjects; inverse of PS for treatment and inverse of (1-PS) for control; another stabilized weight (using Xu 2010 paper). If I understood correctly, I should have gotten same result (or direction) when assessing effect of exposure (treatment vs control) on outcome in each scenario. However I am getting no association in first case, significant association in second case, and borderline insignificance in third case. I love the result I am getting in second case but I am hesitant to accept it as it is because a) I am getting different results for using different weights and b) I checked distribution of second weight variable and there is no overlap between treatment and control weights. all treatment weights are much higher than all control weights.Basically my question is what should I do since I am getting different result using different weight? thank you
You might find it helpful to look at the section on Propensity Score Weighting in the documentation for PROC PSMATCH. The second weights you describe are typically referred to as inverse probability of treatment weights (IPTW) and the third weights you describe are typically called the stabilized IPTW. When your weights are determined based on a single treatment both types of weights should provide similar estimates. However, as you have observed, depending on how these weights are used in your effect estimation the different weights might lead to different variance estimates as discussed in this SAS note. If you are using the weights as a frequency, then the IPTW weights would lead to a larger sample size which would drive effect estimates towards significance. The same would also be true if you used the weights as analytic weights without using an empirical or robust estimate for the standard errors (like in a GEE model). This is less likely to occur with stabilized IPTW because they should have an average of about one in each of the treatment conditions.
Thank you for your quick response.
I used calculated weight terms in PROC GENMO, WEIGHT statement so I believe I am not using weights as frequency.
I think I will stick with stabilized weights which shouldn't be a problem from what you are saying.
Dear Rick,
I am writing my thesis which applied Fama and French 3 factors model
R pt − Rft = α + βp(Rmt − Rft) + SpSMBt + hpHMLt + ept
I want to use Weighted least squares (WLS) procedures. Monthly returns in the WLS model are weighted by √Nt ,
where Nt stands for the number of firms in each observation (month t).
I first generate the variable weight by "generate weight = sqrt(N)". Then I am considering between two commands below
"Regress R pt-Rft MktRF SMB HML [aw=1/ weight]"
"Regress R pt-Rft MktRF SMB HML [aw=weight]"
Could you please let me know which one is the correct one for the above requirement?
(I am using STATA).
Many thanks for your help!
Best regards,
Chi
I suggest you discuss issues like this with your advisor, who can help you to understand the statistical model as it relates to your data. Think about a concrete situation. For example, suppose your first observation represents 100 firms and the second represents 4 firms. Which observation should receive more weight? Good luck!
is there any way to use nominal variable as a weight for regression analysis? Also how can I use 2 nominal variables as a weight at the same time in regression model? For ex: Wanted to check relation between # of sick leaves and enrollment status to health promotion program. But want to weight by sex (M and F), worktype (office, sales, labor). Pls help.
You would need to use the categorical variables to encode a numeric weight variable. You can use IF-THEN/ELSE logic or the SELECT-WHEN statement. For example, you could say:
if sex='M' & worktype='office' then
weight = 0.7;
else if sex='F' & worktype='office' then
weight = 0.8;
else if ...
I have got two observations
A -1.9 3 3 -5 4 3.8 -2 8 5.9
B -18.81 -18.87 -19.37 -19.24 -19.46 -19.23 -19.06 -18.93 -18.71
I have normalize this data and then i perform clustering. The result shows clusters completly on the basis of A, but i want to give priority to B, so i want to assign weights to B. How to assign weight to B parameter. Please help.
Any reasonable clustering algorithm will find at least two clusters for these data. I suggest you post your data and SAS program to the SAS Support Communities.
Hi Rick, This is a nice blog. I just want to know that what's the calculation behind weighting the multiple variables. Single variable is fine. But if we need to weigh multiple variables then what logic we need to apply in excel so all variables weighted percentages will remain intact.
This article is about weighting observations, not variables. There is one weight variable and it assigns a weight for each observation.
Hi Rick,
My colleagues and I are having a debate and no one seems to have found a solid answer. We are hoping you can help.
I am using PROC GENMOD with gamma dist and log link to model per member per month (PMPM) costs. The bivariate model regresses cohortID on PMPM costs (= total costs/ follow-up months). The full model calls for inverse probability of treatment weighting (IPTW) and several covariates (which are time invariant). So we have two questions: 1) if our DV is already in the PMPM format, should we also apply a weight (and if so, what)? We know to use the offset = log(follow up months) when DV is total costs. 2) If we should apply a weight to when costs are in PMPM format, should we calculate the new weight as IPTW*follow-up_weight?
Many thanks!!
You can ask questions like this at the SAS Support Communities. Post the code you are using along with your question.
Hi! I am trying to understand how to create a weight variable for survey data that was collected by a colleague. I am struggling to find what steps i need to follow to create my weight variable in order to use the Survey procedures in SAS. Thank you for your help!
You should consult a book such as Lohr (2009), Sampling: Design and Analysis. Your colleague might already have the design weights. Basically, the weight for each observation in the sample is the total number of individuals in the population that are represented by the observation. For example, if there are 1000 people in the population and you sample 50 with equal probability, then each person in the sample represents 20 people in the population.
Hi Rick,
Do you know if there is a way to apply survey weights to a dataset and then getting an output for that to merge with another dataset? I have an NHANES dataset that I want to merge with a separate dataset that has counts for a Poisson regression, but I don't know if there is a way for me to apply the weights prior the the merge?
You can post sample data and your question to the SAS Support Communities.
You might want to look at the SURVEYSELECT procedure in SAS/STAT.
Hello Rick, what is better? weight by sex, age and region or weight by sex and age? what are the criteria to optimize the weights?
Thak you
I have a survey tracker that we are going to start weighting but we're not going to weight historical data. There are various segments that will be weighted. If analyzing trends and I have unweighted and weighted data, how can you do this? I'm thinking I apply the current weights to historical data; however, i cannot compare segments in different time periods but only each segment over time - as the proportions wouldn't change that much. Of course, it would be best if i could get historical population #s to weight to and apply weights by each year/time period. How would you do this?
Hi Rick,
I would like to fix a regreesion model to a collection of lakes. Let´s say I want to regress chlorophill concentration vs phosphorus concentration. Now, some lakes were sampled multiple times, while others were sampled only once. I am trying to avoid that the most frequently lakes have a disproportionate influence on the model. Would it be possible and correct to use the inverse of the number of observation for each lake as the weighing variable?
Thank you!
I don't think so. I suggest you ask this question on a forum such as SAS Support Communities where you can share more information. If this is a designed survey, the survey weights depend on how the lakes were chosen (the design of the experiment). But if this is clustered data, you might want to consider using a mixed modeling procedure where the lake is a random effect.
Hi Rick,
I'm conducting research on the topic; improving the planning stage of the public investment management framework of a country. I have 4 criteria to weigh their relative importance to the goal; Standard Guidance, Formal Project Appraisal, Independent Review, and Project selection and budgeting. Each of these criteria has at least 4 sub-criterion the contribute to the efficiency of the criteria. I want to use the "Weighted Average Method" but I have issues with how to assign weight to each of the criteria. Kindly help me with your experience on how I can do this. You can also recommend a more easy but viable method for me.
It sounds like you want to create a weighted combination of the VARIABLES, not the observations. See "Rankings and the geometry of weighted averages" and the application at "A comparison of different weighting schemes for ranking sports teams."
Dear Rick,
My co author and I are using a sample survey where weights are provided such that sample reflects the composition of the population.
We are using different software packages and getting different standard errors (SAS PROC REG for my part) and the STATA regression procedure. Our results are different to the point where some variables are significant in STATA and not in PROC REG. I would be grateful for any guidance.
Many thanks,
Stephen
Sure. I have three tips:
1. If you have survey weights, use PROC SURVEYREG to analyze the data.
2. When you compare different packages, be aware that the default options are often different between software.
3. When you want to ask a SAS programming question, post your code and data to the SAS Support Communities.
Hi Rick,
Thank you for the article! I am interested in figuring out how the weight statement actually works from a mathematical/practical point of view. Let's say in a dataset, we use a weights variable called WEIGHTS and it has 4 observations. The full dataset is as follows and the proc logistic function is run as such:
WEIGHTS: 1 , 2 , 1.5 , 3
A: 5, 10, 15, 20
B: Yes, No, Yes, No (encoded as 1,0,1,0)
Dependent_Variable: 1, 2, 3, 1
proc logistic data = above outest = _____ ;
class Dependent Variable (ref ="1");
weight WEIGHTS
model Dependent Variable = A B / link = glogit;
run;
How exactly is the weight statement affecting each observation? Does it affect both the independent/dependent variable? What would the dataset look like after the weighting is done before the model?
Many thanks,
Kevin
In terms of multiplication, the square roots of the weights are used to multiply each row of the independent variables and the dependent variable. You can read the full mathematical details in the PROC LOGISTIC doc, but I suggest you start by understanding how weights affect OLS regression.
Thank you Rick! From the GLM article, it claims that the weight statement changes the equation for the Beta coefficients. In the PROC LOGISTIC weight documentation, it claims "each observation in the input data set is weighted by the value of the WEIGHT variable" which I interpreted as each independent variable for a given observation is multiplied by the weight value of the respective observation. Perhaps they are the same (I apologize as I haven't gotten the chance to prove it for myself yet) but I am just wondering which interpretation is correct and if it is the latter, how does the weight multiplication handle categorical variables?
Many thanks,
Kevin Bai
Please read "Visualize a weighted regression," if you haven't already.
Unweighted least-squares regression uses the "normal equations" (X`*X) beta = (X`*Y) and solves for the regression estimates, beta. Here X is the design matrix (including dummy variables for categorical effects) and Y is the vector of observed responses. If you use weights, you multiply the i_th row of X and Y by sqrt(w_i). In matrix form, the weighted normal equations are (X`*W*X) beta = (X`*W*Y), where W is the square matrix that has the weights on the diagonal.
There is no special treatment for categorical vs interval variables. Each categorical variable is represented by columns in the design matrix.
Notice that the multiplication factor is the square root of the weight, not the weight value itself.
Good luck in your research.
Thank you for the mathematics Rick! I was wondering if you happen to have the documentation for how to produce the standard errors of beta coefficient estimates in the multinomial case. I have been unable to find it online (except in the binomial case).
In general, you should ask SAS-related questions on the SAS Support Communities. If you have a question about statistical theory, I sometimes suggest the Cross Validated site.
Standard errors are computed in various ways, so be sure to specify what procedure you are using.
Thanks Rick! So it would be safe to say that to replicate this using SAS, one could not simply multiply each variable in the input dataset (dummies provided) by the square root of the weight for each observation and run the PROC LOGISTIC command without the weight statement and expect the same result as using the weight statement without any changes to the input dataset?
No, it's not that simple for logistic regression. My previous response was for least squares regression, and I suggest that you understand the simpler linear problem first. For OLS, you will get the same answer for the regression parameter estimates if you multiple each response value by the sqrt(weight) and also each row of the design matrix by sqrt(weight), as I have indicated.
However, for logistic regression the response is binary and the estimation procedure requires solving a nonlinear optimization problem.
You can't multiply a binary response (0/1) by the sqrt(weight) because that will give you more than two response values. Instead, form linear combinations of the (weighted) design columns and maximize the log-likelihood to obtain the parameter estimates.