By default, when you use the SERIES statement in PROC SGPLOT to create a line plot, the observations are connected (in order) by straight line segments. However, SAS 9.4m1 introduced the SMOOTHCONNECT option which, as the name implies, uses a smooth curve to connect the observations. In Sanjay Matange's blog, he shows an example where the SMOOTHCONNECT option interpolates points in a time series by using a smooth curve. In the example, the smooth curve does a good job of smoothly connecting the evenly spaced data points.
However, in a second post, Sanjay shows how the SMOOTHCONNECT option can result in curves that are less ideal. Here is a SAS program that reproduces the gist of Sanjay's example:
data Ex1; input segment $ x y; datalines; A 0 0 A 1 0 A 2 -3 A 3 -1 B 0 0 B 1 0 B 2 2 B 3 1 ; proc sgplot data=Ex1; series x=x y=y / group=segment markers smoothconnect; run; |
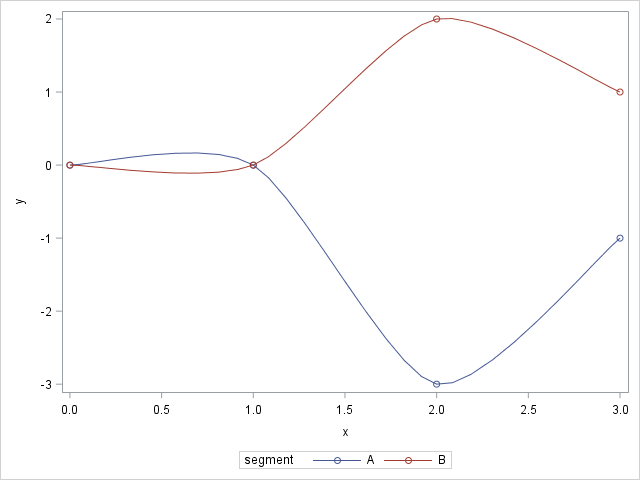
As you can see, groups A and B have identical values for the first two observations. However, the remaining Y values for group A are negative, whereas the remaining Y values for group B are positive. Notice that the interpolating curve for group A rises up before it dives down. Similarly, the curve for group B dips down before it rises up.
This visualization could give the wrong impression to the viewer of the graph, especially if the markers are not displayed. We only have data for four values of X. However, the SMOOTHCONNECT option makes it appear that the graph for group A was higher than group B on the interval (0, 1). That may or may not be true. The curves also give the impression that the curve for group A began to decrease prior to x=1, whereas in fact we have no idea when the curve reached a maximum and began to decrease.
5 things to remember when using the SMOOTHCONNECT option in SGPLOT #DataViz Click To TweetThe SMOOTHCONNECT option can be useful for visualizing time series data, but as with any tool, it is important to know how to use it responsibly. In thinking about these issues, I compiled a list of five ways that the SMOOTHCONNECT option might give a misleading view of the data. By understanding these issues, you can use the SMOOTHCONNECT option wisely. Here are some potential pitfalls to connecting points by using a smooth curve.
- Before the curve goes down, it often goes up.
- The curve gives the impression that we know the location of peaks and valleys.
- The high and low points on the curve might exceed the range of the data.
- The curve can display quick (possibly unrealistic) changes in direction.
- The curve can bend backward, or even create a loop.
Sanjay's example demonstrates the first three issues. Notice that the maximum Y value for group A in the data is Y=0, but the interpolating spline exceeds that value.
To demonstrate the fourth and fifth items requires an artificial example and data that is not evenly spaced along the X variable:
data Ex2; input x y; datalines; 0 0 0.95 0.95 1 1 2 -2 ; proc sgplot data=Ex2; series x=x y=y / markers smoothconnect; yaxis max=1.5; run; |
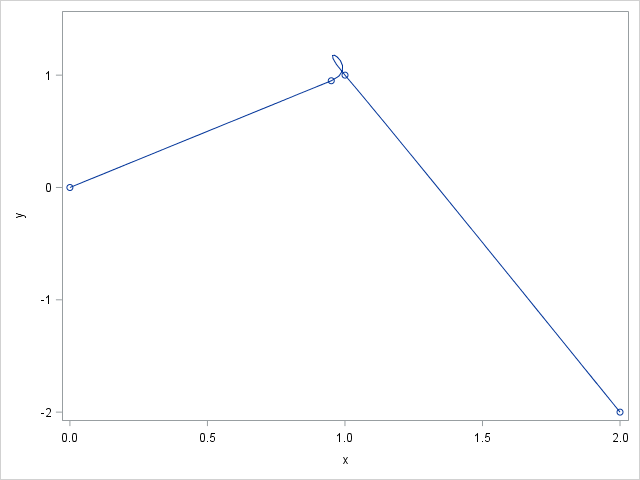
There are only four points in the data set, but the SMOOTHCONNECT curve for these data exhibits a sharp turn (in fact, a loop). I intentionally created data that would create this behavior by making the data linear for X < 2. I also made the second data point very close to the third data point so that the interpolating curve would have to gyrate widely to pass through the points before sloping down to pass through the fourth point.
Implications for data visualization
It is well known among applied mathematicians that interpolation can lead to issues like these. These issues are not caused by a bug in SAS, but by the fact that you are trying to force a smooth curve to pass through every data point. I point them out so that SAS users who are using SGPLOT can be aware of them.
If your data are evenly spaced in the horizontal direction, the first three issue are usually small and innocuous. The last two issue will not occur. Therefore, it is safe to use the SMOOTHCONNECT option for evenly spaced data.
If your data are not evenly spaced, here are a few guidelines to help you avoid wild interpolating curves:
- Use straight lines. In most cases, it is perfectly acceptable to connect your data with straight line segments, so just omit the SMOOTHCONNECT option.
- Use a smoothing spline that does not interpolate. Both PROC TRANSREG and PROC IML support cubic splines. In SAS 9.4m3, PROC SGPLOT supports Bezier splines by using the SPLINE statement.
- Use a statistical technique to fit a smooth curve to data. Several smoothers are built into PROC SGPLOT, including the LOESS and PBSPLINE statements.
In summary, if you use the SMOOTHCONNECT option in the SERIES statement, SAS will pass a smooth curve through the points. When the points are unevenly spaced in X, the curve might need to quickly change direction to pass through all the data. The resulting curve might not be a good representation of the data. In this case, you might need to relax the requirements of a smooth interpolating curve, either by using a piecewise linear interpolation or by using a smooth curve that is not constrained to pass through the data.

2 Comments
Hi Rick, the smootconnect option is not available with the band statement. Do you have a trick for smoothing highlighed parts of a series plot?
Thanks!
The bullet list near the end of the article presents several alternatives.