After reading my article about how to use BY-group processing to run 1000 regression models, a SAS programmer asked whether it is possible to reorder the output of a BY-group analysis. The answer is yes: you can use the DOCUMENT procedure to replay a portion of your output in any order you like. It is a feature of the SAS ODS system that is not very well known to statisticians. Kevin Smith (2012) has called PROC DOCUMENT "the most underutilized tool in the ODS toolbox."
The end of this article contains links to several papers that explain how PROC DOCUMENT works. I was first introduced to PROC DOCUMENT by Warren Kuhfeld, who uses it to modify the graphical output that comes from statistical procedures.
Reordering output (the topic of this article) is much easier than modifying the output. There is a SAS Sample that shows how to use PROC DOCUMENT to reorder BY groups, but I will show a simpler variation. The SAS Sample mentions that you can also use SAS macros to order the output from BY-group analyses, but the macro method is less efficient, computationally speaking.
Use PROC DOCUMENT to reorder SAS output
Suppose you use multiple procedures in an analysis and each procedure uses BY groups. The SAS output will consist of all the BY groups for the first procedure followed by all the BY groups for the second procedure. Sometimes it is preferable to reorder the output so that the results from all procedures are grouped by the BY-group levels.
A basic reordering of the SAS output uses the following steps:
- Use the ODS DOCUMENT statement to store the tables and graphs from the analyses into a destination called the document.
- Use the LIST statement in PROC DOCUMENT to examine the names of the tables and graphs within the document.
- Use the REPLAY statement in PROC DOCUMENT to send the tables and graphs to other ODS destinations in whatever order you choose.
Step 1: Store the output in a document
The following statements generate descriptive statistics for six clinical variables and for each level of the Smoking_Status variable. The Smoking_Status variable indicates whether a patient in this study is a non-smoker, a light smoker, and so on. PROC MEANS generates statistics for the continuous variable; PROC FREQ generates counts for the levels of the discrete variables. The ODS DOCUMENT statement writes all of the ODS output information to a SAS document (technically an item store) called 'doc':
proc sort data=sashelp.heart out=heart; /* sort for BY group processing */ by smoking_status; run; ods document name=doc(write); /* wrap ODS DOCUMENT around the output */ proc means data=heart; by smoking_status; var Cholesterol Diastolic Systolic; /* 1 table, results for three vars */ run; proc freq data=heart; by smoking_status; tables BP_Status Chol_Status Weight_Status; /* 3 tables, one for each of three vars */ run; ods document close; /* wrap ODS DOCUMENT around the output */ |
Step 2: Examine the names of the objects in the document
At this point, the output is captured in an ODS document. Each object is assigned a name that is closely related to the ODS name that is displayed if you use ODS TRACE ON. You can use PROC DOCUMENT to list the contents of the SAS item store. This will tell you the names of the ODS objects in the document.
PROC DOCUMENT is an interactive procedure, which means that the procedure continues running until you submit the QUIT statement. You can submit a group of statements followed by a RUN statement to execute the procedure interactively. The following statement runs a LIST statement, but does not exit the procedure:proc document name=doc(read); list / levels=all bygroups; /* add column for each BY group var */ run; |
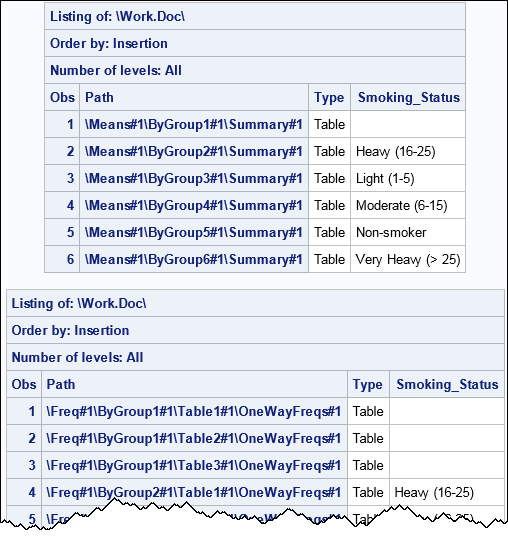
The output shows the table names. The tables from PROC MEANS begin with "\Means" and end with the name of the table, which is "Summary." (The references explain the purpose of the many "#1" strings, which are called sequence numbers.) Similarly, the tables from PROC FREQ begin with "\Freq" and end with "OneWayFreqs." Notice that the listing includes the BY-group variable as a column. You can use this variable to list or replay only certain BY groups. For example, to list only the tables for non-smokers, you can run the following PROC DOCUMENT statements:
/* caret (^) is "current directory," not "negation"! */ list ^ (where=(Smoking_Status="Non-smoker")) / levels=all bygroups; run; |
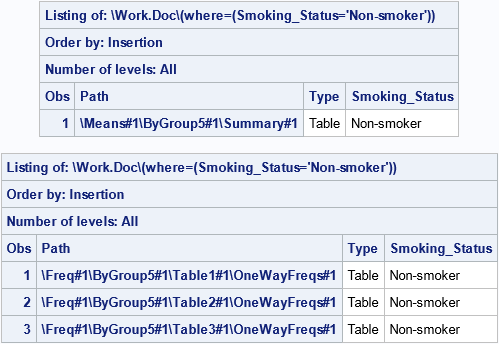
The output shows that there are four tables that correspond to the output for the "Non-smoker" level of the BY group.
Step 3: Replay the output in any order
The previous section showed that you can use a WHERE clause to list all the tables (and graphs) in a BY group. The REPLAY Statement also supports a WHERE clause, and you can use the REPLAY statement to send only those tables to the open ODS destinations. The DOCUMENT procedure is still running, so the following statements produce the output:
replay ^ (where=(Smoking_Status="Non-smoker")); /* levels=all is default */ run; |
The output is not shown, but it consists of all tables for which Smoking_Status="Non-smoker," regardless of which procedure created the output.
Notice that the "Non-smoker" group was the fifth level (in alphabetical order) of the Smoking_Status variable. You can use multiple REPLAY statements to send output for other levels in any order. For example, you might want to output the tables only for smokers, and order the output according to how much tobacco the patients consume. The following statement output the tables for smokers, grouped by tobacco usage:
/* replay output in a different order */ replay ^(where=(Smoking_Status="Light (1-5)")); replay ^(where=(Smoking_Status="Moderate (6-15)")); replay ^(where=(Smoking_Status="Heavy (16-25)")); replay ^(where=(Smoking_Status="Very Heavy (> 25)")); run; quit; |
For brevity I have left out many details about the syntax of PROC DOCUMENT, but I hope the main idea is clear: You can store the results of multiple computations in a document and then replay any subset of the results in any order. The references in the next section contain many useful tips and techniques to help you get the most out of PROC DOCUMENT.
References
- SAS Documentation: "Restructuring Output with PROC DOCUMENT" in SAS 9.4 Output Delivery System: Advanced Topics
- SAS Documentation: The DOCUMENT Procedure in SAS 9.4 Output Delivery System: Procedures Guide
- Smith, K. (2012) "ODS DOCUMENT From Scratch".
- Tuchman, M. (2012) PROC DOCUMENT by example using SAS.
- Zender, C. (2009) "Have It Your Way: Rearrange and Replay Your Output with ODS DOCUMENT".
For an innovative use of PROC DOCUMENT to modify statistical graphics, see the papers and books by Warren Kuhfeld, such as Kuhfeld (2016) "Highly Customized Graphs Using ODS Graphics."

2 Comments
Pingback: Display output conditionally with PROC DOCUMENT - The DO Loop
Thanks for that very useful explanation. I was aware of PROC DOCUMENT but had not (yet) used it. The integration with BY processing looks as if it will save a lot of messing about with macro loops.