Many introductory courses in probability and statistics encourage students to collect and analyze real data. A popular experiment in categorical data analysis is to give students a bag of M&M® candies and ask them to estimate the proportion of colors in the population from the sample data. In some classes, the students are also asked to perform a chi-square analysis to test whether the colors are uniformly distributed or whether the colors match a hypothetical set of proportions.
M&M's® have a long history at SAS. SAS is the world’s largest corporate consumer of M&M's. Every Wednesday a SAS employee visits every breakroom on campus and fill two large containers full of M&M's. This article uses SAS software to analyze the classic "distribution of colors" experiment.
The proportion of colors for M&M's
The "plain" M&M candies (now called "milk chocolate M&M's") are produced by the Mars, Inc. company. The distribution of colors in M&M's has a long and colorful history. The colors and proportions occasionally change, and the distribution is different for peanut and other varieties. A few incidents from my lifetime that made the national news are:
- 1976: Red M&M's are replaced by orange. This was a big story. "Red dye #2" had been discovered to be a carcinogen. Although Mars did not use this dye in their candies, the company changed colors to alleviate customer concerns.
- 1986: Red M&M's are brought back. Orange stays.
- 1995: The tan color is replaced by a more vivid color. In a promotional campaign, the public is asked to vote for the replacement color. Ten million vote; blue wins in a landslide.
- Late 1990s: The M&M web site lists the distribution of colors. Circa 1997, the color distribution was
30% brown, 20% yellow, 20% red, 10% orange, 10% green, and 10% blue.
Statistician and educators rejoice and publish many papers on the topic. -
2008: Mars changes the color distribution to
24% blue, 20% orange, 16% green, 14% yellow, 13% red, 13% brown.
Some time later, the proportions were removed from the web site and have not been restored. - 2017: What is the current distribution of colors? Read on for an interesting story!
Proportions and chi-square test
The breakroom containers at SAS are filled from two-pound bags. So as to not steal all the M&M's in the breakroom, I conducted this experiment over many weeks in late 2016 and early 2017, taking one scoop of M&M's each week. The following data set contains the cumulative counts for each of the six colors in a sample of size N = 712:
data MandMs; input Color $7. Count; datalines; Red 108 Orange 133 Yellow 103 Green 139 Blue 133 Brown 96 ; |
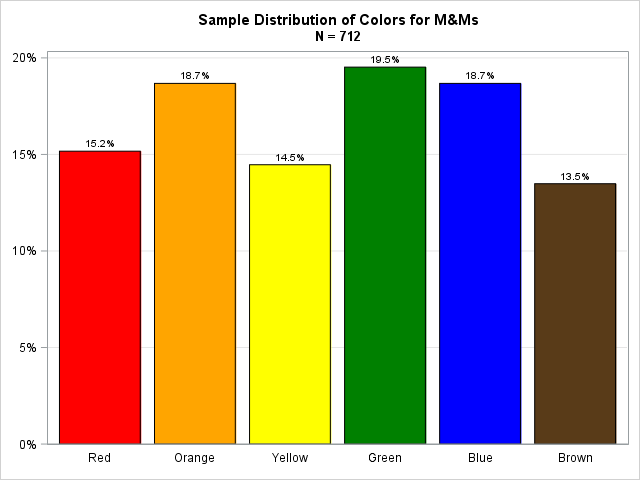
A bar chart that shows the observed distribution of colors in M&M's is shown at the top of this article.
To estimate the proportion of colors in the population, simply divide each count by the total sample size, or use the FREQ procedure in SAS. PROC FREQ also enables you to run a chi-square test that compares the sample counts to the expected counts under a specified distribution. The most recent published distribution is from 2008, so let's test those proportions:
proc freq data = MandMs order=data; weight Count; tables Color / nocum chisq /* 2008 proportions: red orange yellow green blue brown */ testp=(0.13 0.20 0.14 0.16 0.24 0.13); run; |
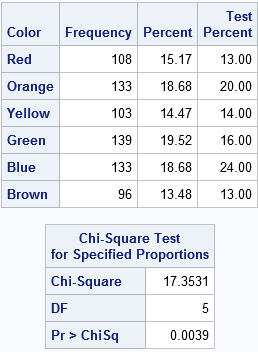
The observed and expected proportions are shown in the table to the right. The chi-square test rejects the test hypothesis at the α = 0.05 significance level (95% confidence). In other words, the distribution of colors for M&M's in this 2017 sample does NOT appear to be the same as the color distribution from 2008! You can see this visually from the bar chart: the red and green bars are too tall and the blue bar is too short compared with the expected values.
You need a large sample to be confident that this empirical deviation is real. After collecting data for a few weeks, I did a preliminary analysis that analyzed about 300 candies. With that smaller sample, the difference between the observed and expected proportions could be attributed to sampling variability and so the chi-square test did not reject the null hypothesis. However, while running that test I noticed that the green and blue colors accounted for the majority of the difference between the observed and theoretical proportions, so I decided to collect more data.
Simultaneous confidence intervals for the M&M proportions
As I explained in a previous article, you can use the sample proportions to construct simultaneous confidence intervals for the population proportions. The following SAS/IML statements load and call the functions from the previous post:
%include "conint.sas"; /* define the MultCI and MultCIPrint modules */ proc iml; load module=(MultCI MultCIPrint); use MandMs; read all var {"Color" "Count"}; close; alpha = 0.05; call MultCIPrint(Color, Count, alpha, 2); /* construct CIs using Goodman's method */ |
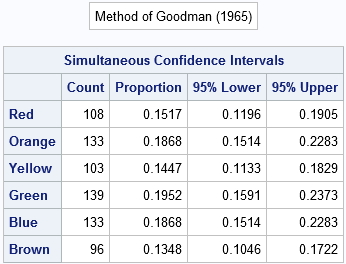
The table indicates that the published 2008 proportion for blue (0.24) is far outside the 95% confidence interval, and the proportion for green (0.16) is just barely inside its interval. That by itself does not prove that the 2008 proportion are no longer valid (we might have gotten unlucky during sampling), but combined with the earlier chi-square test, it seems unlikely that the 2008 proportions are applicable to these data.
Calling the experts
The published proportions for green and blue do not seem to match the sample proportions from 2008. For this large sample, the published proportion of blue is too large whereas the published proportion of green is too small.
From reading previous articles, I know that the Customer Care team at M&M/Mars is very friendly and responsive. Apparently they get asked about the distribution of colors quite often, so I sent them a note. The next day they sent a breakdown of the colors for all M&M candies.
Interestingly, plain (and peanut) M&M's are now produced at two different factories in the US, and the factories do not use the same mixture of colors! You need to look on the packaging for the manufacturing code, which is usually stamped inside a rectangle. In the middle of the code will be the letters HKP or CLV. For example, the code might read 632GCLV20.
- CLV: The Cleveland plant uses the following proportion of colors for plain M&M's:
Red=0.131, Orange=0.205, Yellow=0.135, Green=0.198, Blue=0.207, and Brown=0.124.
- HKP: The Hackettstown, NJ, plant uses the following proportion of colors for plain M&M's:
Red=0.125, Orange=0.25, Yellow=0.125, Green=0.125, Blue=0.25, and Brown=0.125.
Although I did not know about the manufacturing codes when I collected the data, I think it is clear that the bulk of my data came from the CLV plant. You can create a graph that shows the sample proportions, the 95% simultaneous confidence intervals, and vertical hash marks to indicate the CLV population parameters, as follows:
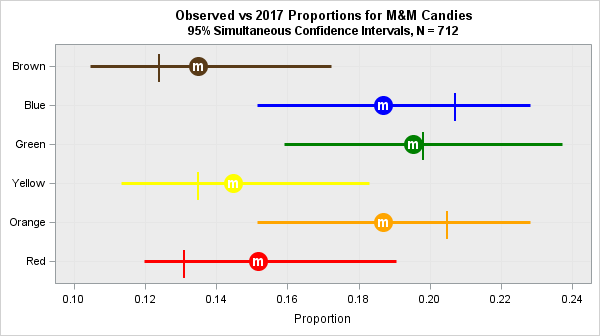
The graph shows that the observed proportions are close to the proportions from the CLV plant. All proportions are well within the 95% simultaneous confidence intervals from the data. If you rerun the PROC FREQ chi-square analysis with the CLV proportions, the test does not reject the null hypothesis.
Summary
The experimental evidence indicates that the colors of plain M&M's in 2017 do not match the proportions that were published in 2008.
After contacting the M&M/Mars Customer Care team, I was sent a new set of proportions for 2017. The color proportions now depend on where the candies were manufactured. My data matches the proportion of colors from the Cleveland plant (manufacturing code CLV).
If you are running this analysis yourself, be sure to record whether your candies came from the HKP or CLV plant. If you want to see my analysis, you can download the complete SAS program that analyzes these data.
Educators who use M&M's to teach probability and statistics need to record the manufacturing plant, but this is still a fun (and yummy!) experiment. What do you think? Do you prefer the almost-equal orange-blue-green distribution from the CLV plant? Or do you like the orange-blue dominance from the HKP plant? Or do you just enjoy the crunchy shell and melt-in-your-mouth goodness, regardless of what colors the candies are?

48 Comments
I plotted some M&M color data a while back, and I found it useful to sort them by most-to-least frequent, and to show both the percent and frequency for each color. Here's a link to my graph, and the code, in case that would be of interest to anyone:
http://robslink.com/SAS/democd37/MnM.htm
http://robslink.com/SAS/democd37/MnM_info.htm
SAS Curriculum Pathways has an M&M color distribution data set in Data Depot: https://www.sascurriculumpathways.com/portal/#info/2347
Wonderful article - thank you Rick! I now wonder if other kinds of M&Ms like milk chocolate and peanut butter have the same distributions.
Milk chocolate (="plain") and dark chocolate have the same distributions. Peanut, almond, crispy, and minis have different distributions (although minis are VERY close to the HKP distribution for milk chocolate). The distributions of colors for peanut M&M's differ between the HKP and CLV facility.
Do you really care though??????
I assume you mean "since they taste so good, does it matter what colors they are?" I'm not a psychologist, but I've read that food that looks appealing is perceived to taste better than food that looks unappealing. But I doubt whether 25% blue versus 20% blue would make a significant difference in our enjoyment of these tasty treats.
YES! IF you are using small packages of M&Ms to teach lessons about sampling distributions in a statistics class--as I have done, YOU REALLY CARE! My demos worked for me like a charm through the 90s and then started going awry. I used to always get 30% brown. I called the M&M company and could not find anyone who could tell me what the new distributions were or if they had changed. They did, however, send me a coupon for 1 or 2 big bags of M&Ms. Anyways...I switched to a simulator for the lessons.
Thanks for writing. I think your story emphasizes an important truth: in real life we almost always do not know the value of population parameters. The goal of statistics is to estimate parameters from data. In your case, the data was telling you that the hypothesized proportion (from the 90s) no longer fit the data.
I like the orange-blue dominance. I'm a big Denver Broncos fan!
SherriJoyce King and I presented papers using M&Ms to produce Chi-Square Control Charts way back in 1994
The papers can be found at:
http://www.sascommunity.org/sugi/SUGI94/Sugi-94-246%20King%20Alexander.pdf (Part 1 Tutorial)
http://www.sascommunity.org/sugi/SUGI94/Sugi-94-198%20Alexander%20King.pdf (Part 2 Statistical Control Presentation)
http://www.lexjansen.com/sesug/1994/SESUG94056.pdf (SESUG 1994 Conference)
Pingback: The distribution of flavors in Halloween candies - The DO Loop
Just for fun I contacted the Mars corporation and asked for their distributions. Here is the response they gave:
"Our color blends were selected by conducting consumer preference tests, which indicate the assortment of colors that pleased the greatest number of people and created the most attractive overall effect.
On average, our mix of colors for M&M'S CHOCOLATE CANDIES is:
M&M'S MILK AND DARK CHOCOLATE HKP: 25% Cyan Blue, 25% Orange, 12.5% Green, 12.5% Bright Yellow, 12.5% Red, 12.5% Brown.
M&M'S MILK AND DARK CHOCOLATE CLV: 20.7% Cyan Blue, 20.5% Orange, 19.8% Green, 13.5% Bright Yellow, 13.1% Red, 12.4% Brown.
Each large production batch is blended to those ratios and mixed thoroughly. However, since the individual packages are filled by weight on high-speed equipment, and not by count, it is possible to have an unusual color distribution."
I like that last sentence because it helps get the students thinking about whether or not the samples of bags that we got from our local stores is actually a random sample and leads to a talk about how the candies are distributed from the factory to the stores and then into our bellies.
Thank you, Dr. Wicklin, for this informative blog. I used it to develop an in-class activity for my Introductory Statistics course. The students enjoyed themselves and were exposed to the Goodness of Fit test and simultaneous confidence intervals, a perfect way to wrap up the term.
Wonderful! Thanks for sharing.
Thank you!
Our bags say CLHKP... is that still the Hackettstown plant??
That would be my guess. Unfortunately, the company does not notify me when they change their processes! :-)
Thanks!
Saw this on an Australian news blog site... "A statistician got curious about M&M colours and went on an endearingly geeky quest for answers" https://www.sbs.com.au/food/article/2017/03/16/statistician-got-curious-about-mm-colours-and-went-endearingly-geeky-quest
Thanks. That is a reprint of the article that qz.com published last year.
We just did this activity in my class and found that the new size of M&Ms...the 10.70oz Sharing size, does not have the code for either Hackettstown or Cleveland plant. Instead the bags all have the code 4CW (we looked at multiple bags of this size, plain and peanut). Does anyone know what this particular code stands for and why that particular size is different??
I called today - 4CW must be Bartlett IL as that is where the Family Size bag that I have was produced......so apparently there's more than just the two plants!
I ran across the qz.com article today and followed the link here. Thanks for letting me know I am not the only OCD M&M geek out there.
I do want to share a quick story with you that I think you might enjoy.
I should preface this with the fact that I am a huge Texas Longhorn fan.
Approximately 10 years ago, I had a routine of picking up a pack of peanut M&M's from the company snack bar every Friday afternoon.
As part of the routine, I sorted them by color before enjoying their chocolaty goodness. I did mention OCD, right?
This particular Friday was the day before the first game of the season and I happened to notice that there were more orange M&M's than the primary color of whomever we played.
Not a big deal, until we won the game.
Making note of this oddity, I began to track the 'accuracy' of the M&M's for the remainder of the season.
They went 12 and 1 in correctly predicting the outcome of the games. Note that that particular year, Texas did not go 12 and 1, but the M&M's did.
Historical research after reading your article indicates Texas most likely went 10 - 3.
I left the company and got out of the habit of eating M&M' until a few weeks ago. To wrap this up, the M&M's are currently 16 - 3 in predicting the outcome of the games.
After reading your analysis, I understand what is really going on here, but will be buying a pack of peanut M&M's this Friday anyway.
Thanks again for the very enjoyable read.
.
Great story. Thanks for writing. If your M&Ms start to predict the stock market, write back!
Just updating everyone ...
I contacted the Brazilian Mars and they did not tell me the color distributions of M&Ms.
In my stats class, we've got 0.0002 for our P-value...
so frustrating...
5 packages. Our raw values were:
Brown - 26
Yellow - 58
Red - 50
Blue - 58
Orange - 40
Green - 25
Sum = 257
There is no need to be frustrated. Use the proportions from the sample to form a hypothesis about the proportions in the population. That's what the field of statistics is designed to do! In your case, the data are consistent with the null hypothesis:
red=0.20, orange=0.15, yellow=0.225, green=0.10, blue=0.225, and brown=0.10
Thanks, this will be very helpful, as today we are doing the color distribution lab in Intro Biostatistics. We compare different candy companies as well as plain vs peanut M&Ms. Back in the past we did a taste test (blindfolded students) on M&Ms and there was no ability of the students to pick out one color from another - they all tasted alike. So, I'm curious that Mars says it uses taste tests to determine color preference. Other hypotheses can be put forward for the distribution patterns: costs of the various dyes, psychological preferences, random packaging, but not actual taste preferences. But for other multi-colored candies, like jujubes, or skittles, where color and taste are coordinated, taste could be a factor. We start off by testing whether all the colors are equally distributed, but with the information you have provided from Mars Inc., we will include an exercise in testing differences from known proportions. We also do a chi-square heterogeneity test using multiple packages of M&Ms to see how consistent the distributions are from one package to another. Thanks so much for your posting - and now on with our most tasty lab! Happy Holidays!
I suspect that when Mars says "tastes of the consumer," they mean what you call "psychological preferences." In other words, they test what colors distribution looks prettiest in a bowl or a jar.
Hey Rick! I'm an AP statistics student at Apex Friendship High School and came across your research while doing nearly the same experiment! I'm crazy and think that green M&Ms taste the best, so I wanted to see what the proportion of green M&Ms was in a single bag. In my 300+ M&Ms, exactly 19.8% were green. I'm really glad I could find your research and know that I didn't get one strange bag, not that it would matter to me anyways. Thanks!
Thanks for writing. When I was in high school green M&Ms where thought to have certain desirable properties. The M&M company capitalized on those rumors when they designed the "Ms. Green" character, who is flirty and saucy and desired by the red, yellow, and blue characters.
I just opened M&M plain share size and was surprised that no brown. Is that even possible?
Evidently so, since you observed it. The proportions of colors in a sample will resemble the proportion that the company makes only if the company ensures that the colors are uniformly mixed. Perhaps the machine that makes brown candies was down for maintenance or cleaning when your bag was produced.
Some years ago, I opened a vending machine bag of peanut M&M and started shaking out the contents piece by piece. The first five pieces to emerge were orange. It struck me at the time that this was a low-probability event, and I thought how quantifying the event's probability would make a classic problem for a course in probability and statistics. Then it dawned on me that the occurrence of a vending machine bag containing maybe 20 pieces of which five were orange was itself likely to be a rare event, and would add a new layer of complexity. I never got around to following through with the analysis, although I did some additional data collection.
"Data collection" is always enjoyable. It seems to me that the probability of pouring 5 orange candies from your bag is the same as the probability of observing 5 orange candies in consecutive draws from the population. This assumes, of course, that the candies in the bag were randomly selected.
I keep running out of red M&Ms and wondering why, and happily you have already figured it out! (I figured someone had done it but I had no idea it would be someone I knew personally.)
I had no idea that the different plants used different distributions! I've been using the M&M's activity in my classroom for years, and always wondered why our data was always so far off from those 2008 distributions. So of course I ended up down the rabbit hole this morning and aggregated data from the past 5 years (Hackettstown plant). With a sample size of 3,455, our percentages are: 29.6% blue, 11% brown, 11.5% green, 23.8% orange, 14% red, and 7.4% yellow. I still can't figure out how over years there is such a consistently low distribution of yellows (allegedly 12.5% of the manufactured population): 4% in 2016, 4% in 4% in 2018, and 7.4% in 2019. Gaaah!
This is great! I'm using your data to assist with a project on sample proportions for my Into Stats class!
I have used this in class to be able to show by a chi square test which factory the M and M's came from. Up until this year it worked with the percentages you show from 2017. In my last couple of classes, the analysis shows a significant difference in proportion from both plants. (n around 500) Do you have any updated information on whether the color proportions have changed in the last year.
Sorry, no. I did this as a project in 2017 and have no new data.
For anyone curious about an update... in my stats classes today, we have (all CLV): n=1958, red=250, orange=399, yellow=261, green=426, blue=399, brown=223. So, green was a little high (95% C.I. does not capture .198, but 99% does). All others are pretty well in line. We are doing this as a confidence-interval activity, but a chi-square test yields p= about 0.33 for the CLV proportions.
(I realized that I didn't do the chi-square correctly yesterday... it was below 0.2 but still out of the range of a significant difference. I don't remember the exact value when I redid it this morning).
But... something interesting did happen. I had a few more students today who were absent yesterday... further reducing the margin of error, with green still coming out ahead... and now the 99% CI for green begins right at .198! All of the other colors are still much closer to the CLV proportions from 2017... but now the chi-square p-value is just slightly above .05!
This also provoked an interesting classroom discussion about current controversies such as p-hacking.
are you running a different candy company and you're asking about m&m's to help with your company?
OK, so in 2023... things have definitely changed again.
I sent the customer service dept. an email to see if they have any updated percentages. But, several of us did an activity in our statistics classes last week, and here is what we found. All from the Cleveland plant.
https://docs.google.com/spreadsheets/d/1mozKXp9Wcl9U2X97yZEjKCO9Tfnud3FrWRrPzpF2izo/edit?usp=sharing
Raw data from each pack of M&Ms is in columns A-F, aggregate data in H-J, chi-square test against the 2017 proportions in L-O, and 99% z-intervals for each color in Q-S.
Thanks for sharing. As Yoda said, "always in motion is the future."
Hey, we are doing this in my Stats class today. The M&M packs you used: were they the standard size, or sharing size, or other?
I'll post our results too.
The blog post says "the breakroom containers at SAS are filled from two-pound bags."
Updated Color Distribution 2023 from a sample of 3,248 plain M&Ms (all packs were from the NJ factory)
Red - 114 (3.5%)
Orange - 934 (28.8%)
Yellow - 259 (8.0%)
Green - 456 (14.0%)
Blue - 1,121 (34.5%)
Brown - 364 (11.2%)
Pingback: Using geometry and game theory to master the M&M guessing game - SAS Voices