On discussion forums, I often see questions that ask how to Winsorize variables in SAS. For example, here are some typical questions from the SAS Support Community:
- I want an efficient way of replacing (upper) extreme values with (95th) percentile. I have a data set with around 600 variables and want to get rid of extreme values of all 600 variables with 95th percentile.
- I have several (hundreds of) variables that I need to “Winsorize” at the 95% and 5%. I want all the observations with values greater 95th percentile to take the value of the 95th percentile, and all observations with values less than the 5th percentile to take the value of the 5th percentile.
It is clear from the questions that the programmer wants to modify the extreme values of dozens or hundreds of variables. As we will soon learn, neither of these requests satisfy the standard definition of Winsorization. What is Winsorization of data? What are the pitfalls and what are alternative methods?
Winsorization: Definition, pitfalls, and alternatives #StatWisdom Click To TweetWhat is Winsorization?
The process of replacing a specified number of extreme values with a smaller data value has become known as Winsorization or as Winsorizing the data. Let's start by defining Winsorization.
Winsorization began as a way to "robustify" the sample mean, which is sensitive to extreme values. To obtain the Winsorized mean, you sort the data and replace the smallest k values by the (k+1)st smallest value. You do the same for the largest values, replacing the k largest values with the (k+1)st largest value. The mean of this new set of numbers is called the Winsorized mean. If the data are from a symmetric population, the Winsorized mean is a robust unbiased estimate of the population mean.
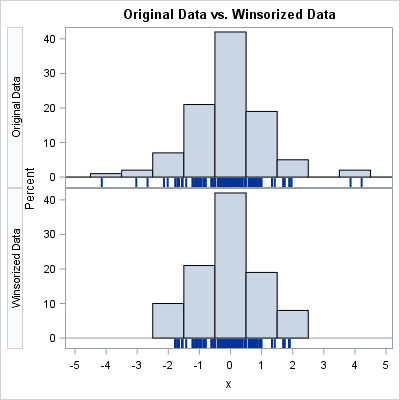
The graph to right provides a visual comparison. The top graph shows the distribution of the original data set. The bottom graph shows the distribution of Winsorized data for which the five smallest and five largest values have been modified. The extreme values were not deleted but were replaced by the sixth smallest or largest data value.
I consulted the Encyclopedia of Statistical Sciences (Kotz et al. (Eds), 2nd Ed, 2006) which has an article "Trimming and Winsorization " by David Ruppert (Vol 14, p. 8765). According to the article:
- Winsorizaion is symmetric: Some people want to modify only the large data values. However, Winsorization is a symmetric process that replaces the k smallest and the k largest data values.
- Winsorization is based on counts: Some people want to modify values based on quantiles, such as the 5th and 95th percentiles. However, using quantiles might not lead to a symmetric process. Let k1 be the number of values less than the 5th percentile and let k2 be the number of values greater than the 95th percentile. If the data contain repeated values, then k1 might not equal to k2, which means that you are potentially changing more values in one tail than in the other.
As shown by the quotes at the top of this article, posts on discussion forums sometimes muddle the definition of Winsorization. If you modify the data in an unsymmetric fashion, you will produce biased statistics.
Winsorization: The good
Why do some people want to Winsorize their data? There are a few reasons:
- Classical statistics such as the mean and standard deviation are sensitive to extreme values. The purpose of Winsorization is to "robustify" classical statistics by reducing the impact of extreme observations.
- Winsorization is sometimes used in the automated processing of hundreds or thousands of variables when it is impossible for a human to inspect each and every variable.
- If you compare a Winsorized statistic with its classical counterpart, you can identify variables that might contain contaminated data or are long-tailed and require special handling in models.
Winsorization: The bad
There is no built-in procedure in SAS that Winsorizes variables, but there are some user-defined SAS macros on the internet that claim to Winsorize variables. BE CAREFUL! Some of these macros do not correctly handle missing values. Others use percentiles to determine the extreme values that are modified. If you must Winsorize, I have written a SAS/IML function that Winsorizes data and correctly handles missing values.
As an alternative to Winsorizing your data, SAS software provides many modern robust statistical methods that have advantages over a simple technique like Winsorization:
- For regression, the ROBUSTREG procedure provides four different methods for handling univariate and multivariate outliers and high-leverage points. You can also use PROC ROBUSTREG to compute robust univariate statistics and to identify multivariate outliers.
- Quantile regression (PROC QUANTREG) also provides robust estimates.
- For univariate data, the UNIVARIATE procedure provides several robust estimates of location and scale. You can use the ROBUSTSCALE option, the TRIMMED= option, and the WINSORIZED= option to obtain robust estimates without modifying the original data. SAS provides these statistics by using the original data.
Winsorization: The ugly
If the data contains extreme values, then classical statistics are influenced by those values. However, modifying the data is a draconian measure. Recently I read an article by John Tukey, one of the early investigator of robust estimation. In the article "A survey of sampling from contaminated distributions" (1960), Tukey says (p. 457) that when statisticians encounter a few extreme values in data,
we are likely to think of them as 'strays' [or]'wild shots' ... and to focus our attention on how normally distributed the rest of the distribution appears to be. One who does this commits two oversights, forgetting Winsor's principle that 'all distributions are normal in the middle,' and forgetting that the distribution relevant to statistical practice is that of the values actually provided and not of the values which ought to have been provided.
A little later in the essay (p. 458), he says
Sets of observations which have been de-tailed by over-vigorous use of a rule for rejecting outliers are inappropriate, since they are not samples.
I love this second quote. All of the nice statistical formulas that are used to make inferences (such as standard errors and confidence intervals) are based on the assumption that the data are a random sample that contains all of the observed values, even extreme values. The tails of a distribution are extremely important, and indiscriminately modifying large and small values invalidates many of the statistical analyses that we take for granted.
Summary
Should you Winsorize data? Tukey argues that indiscriminately modifying data is "inappropriate." In SAS, you can get the Winsorized mean directly from PROC UNIVARIATE. SAS also provides alternative robust methods such the ones in the ROBUSTREG and QUANTREG procedures.
If you decide to use Winsorization to modify your data, remember that the standard definition calls for the symmetric replacement of the k smallest (largest) values of a variable with the (k+1)st smallest (largest). If you download a program from the internet, be aware that some programs use quantiles and others do not handle missing values correctly.
What are your thoughts about Winsorizing data? Share them in the comments.

38 Comments
Very nice article and different points of views.
A quick question. You write: "You do the same for the largest values, replacing the k largest values with the (k+1)st largest value."
Wouldn't this be the (k-1)st largest value that you should replace the k largest values with?
Regards Peter
It depends from which direction you are counting. I was counting "from the outside in." It is the greatest data value that is less than or equal to the k_th largest value.
I had the same thought. I've never heard of anyone "counting 'from the outside in'". It seems like it would only generate confusion (as it has here) and errors.
I'm sorry that my response was confusing. When you sort the data from smallest to largest, you replace the k_th largest values with the (k+1)st largest value. For example, if there are 10 data values and k=3, then the first 3 are replaced by x[4] and the last three (x[8], x[9], and x[10]) are replaced by x[7]. The value x[7] is the 4th largest value, not the third largest.
For a more mathematical description, see the documentation for PROC UNIVARIATE.
Rick, thanks for this excellent explanation. Would you say that this process is also what people mean when they ask about "trimmed mean"? According to the PROC UNIVARIATE doc, these are different -- but I'm not sure that most people are making the distinction.
Thanks for asking this question, Chris. For the trimmed mean, you EXCLUDE the k largest and k smallest values and compute the mean of the remaining N - 2k values. For the trimmed mean, extreme values have NO EFFECT on the estimate of the mean.
For the Winsorized mean, you REPLACE the extreme values by another (not as extreme) data value. You then compute the mean of the modified N values. Thus extreme values still have SOME effect on the estimate, but not as large as they did before being modified.
I think some practitioners prefer to Winsorize data (rather than trimming) because it keeps the number of observations constant. If you replace extreme values by missing values, you get trimmed data, but the missing values wreak havoc on multivariate analyses.
I think practitioners prefer Winzorized over trimmed because it keeps the weight of extreme observations in the tails of the distribution and thus has a lesser effect on estimates of scale.
Great post. Love the quotes. In my first stats class I was lucky to have an instructor who repeatedly emphasized the importance of investigating outliers rather than simply discarding them (or blindly including them). He had a couple key examples. One was Bob Beamon's famous long jump at the 1968 Olympics where he set a world record by nearly two feet (http://blog.minitab.com/blog/fun-with-statistics/visualizing-the-greatest-olympic-outlier-of-all-time). The other was a college that reported one year that the average salary for the graduating class was $200,000 (they happened to have an outlier graduate who was signed to a multi-million dollar pro basketball contract).
Thanks for the comments and link. At UNC-Chapel Hill the most lucrative major (mean salary) is geography...because that was Michael Jordan's major! Median vs mean in action.
Um, I think you mean Windsorized mean vs mean in action
Any robust estimate will reveal the deceit.
My father has a good story about an outlier. It was in a plot of something to do with an oil burner nozzle. The outlier was a resonance which proved very useful for atomising droplets. They got a patent and new product out of it.
Nice! Thanks for sharing.
i am winsorizing some data but having the problem of handling missing values. My codes are replacing most of the missing values. can you suggest some efficient micro or any simple codes which donot replace any missing value rather consider only available values but keep missing values as it is?
Any help will be appreciated.
Good day
Yes. See the article "How to Winsorize data in SAS."
A couple of (hopefully) amusing abecdotes.
1. A colleague of mine working in toxicology in the pharmaceutical industry was always trying to identify the unusual cases, where the drug caused extremely bad reactions. He said "All this talk of truncation and Winsorization is backwards. In my work, I throw away all the "good" data and study the outliers."
2. Another colleague (not a statistician) was a consultant for a medical device start-up company and was seeking advice from me. His client company was making a device that purports to measure the same thing as electroencephalograph (EEG) data on the human heart, but one that can be used easily at home to give early warning signals of heart problems in people with heart conditions. The gold standard is the EEG, but the patient has to be in the medical office hooked up to electrodes to get such data. The medical device company has lots of data comparing the EEG with the device, and found that most of the time, the device works very well, giving measurements within 1% of the gold standard EEG. However, in the rare occasions where the heart is unusually stressed, the device misses the EEG target badly. My colleague had heard that in some academic disciplines it is considered “OK” to delete or Winsorize the outliers. So he deleted the rare occasions where the device badly missed the EEG target. After deletion, he found there were no cases where the device performed badly. Based on that analysis, he was thinking of recommending to his client company that they continue with product development, “as is”!
Thanks for writing. Yes, in many applications (fraud detection comes to mind) the outliers are the only "interesting" cases!
Funny story, I wouldn't be surprised to know that the same approach has been used elsewhere, Just a detail: he wanted to use an electroencephalograph EEG data for the heart? EEC is about the head, electrocardiogram ECG maybe?
I am thinking of Winsorising at the Tukey outlier bounds, i.e. replace all outliers and extremes (both sides of the distribution) with, below by Q1 - 1.5*IQR and above by Q3 + 1.5*IQR. That way the Tukey-outliers are also not discarded but downweighted. I wonder what the influence of such a "Winsorisation" on the new mean and precision would be.
Hey! Great article, that really helps a lot!
Do you have any recommendations on which percentiles should be used for winsorizing? Or how to find out which percentile to use?
Thanks!
My advice is:
1. Use robust statistics, rather than Winsorization, when possible.
2. If you must Winsorize, exclude the smallest percentile that eliminates the problematic outliers. I feel more comfortable with using the 0.01 quantile (1% in each tail) than using the 0.05 quantile (5% in each tail).
3. Realize that when you winsorize you are obtaining statistics that have less variance than the true data. That means any inferences you make (for example, confidence intervals) are likely to be too small.
Thank you for your wonderful explanation. I'm looking at the CMS proposed bundled payment project for radiation and noted that they use winsorization as part of their model. It was such a pleasure to find something that quickly described the process and explained limitations and good points. Now I can explain to my team in laymen's terms what winsorization means and how it affects the model and why it is important that all of us have a basic understanding of the way calculations are being done.
Hi Rick, Thank you for a very informative post, as always. I have a variable that will be log transformed for regression. Should I winsorize the variable before or after the log transformation? Thanks in advance
Assuming that all values are positive, it doesn't matter. If you Winsoized and then take the log, you'll get the same values as if you take the log and then Winsorize. In fact, that result is true for any monotonic increasing transformation of the data.
For a windsorized z-score, you just use the mean and standard deviation of the windsorized data in the formula?
Using the term "z-score" makes me nervous. It is true that you can standardize any variable by subtracting its mean and dividing the centered data by the standard deviation. However, if you use a robust estimate of the mean and a robust estimate of the standard deviation, you obtain a distribution that does not have mean 0 nor standard deviation 1. Therefore it is not a z-score in the classical sense.
Furthermore, the term "Z-score" is usually used when the distribution is normal. The normal CDF and quantiles are used with z-scores to obtain probabilities and to test hypotheses. Non-normal distributions are not usually called z-scores, and definitely not if they do not have mean=0 and std dev=1.
Thank you for your post. This question is related to above questions:
I need to take logs and difference a panel dataset. Then I standardize (I typically demean both the cross section, the time series and then add back the grand mean to have centered data in both dimensions), as I will be running principal components analysis to extract factors.
At the moment, I winsorize before all steps listed above. Do you believe I should winsorize after PCA?
Traditional PCA is not robust to outliers, so if you are going to remove outliers you should do it before PCA.
Quick question if it would make any sense to run robustreg in sas just on the intercept term and retain obs that are identified as outliers using say the M estimation method--as opposed to using the MAD or IQR approaches? Thanks for any thoughts!
Yes, see this article.
And to think, that median is the 50% trimmed mean :)
I'd welcome your thought on this situation: We have a dataset of patients with a rare condition (n=~10 for each of 2 groups). The participants completed a battery of standardized tests that use a mean of 100 and a standard deviation of 15. In some cases, participants did not pass the 'practice items' so did not start the task, and therefore there was no raw data to convert to a standard score. This resulted in 'missing' data throughout the dataset for different tests. We want to represent the performance of this participants in these cases. I was advised to enter the lowest standard score (e.g., 55) in these cases to be able to represent these cases and therefore have a full dataset. My questions are: (1) is this a version of Winsorizing if the missing data were replaced with a stand-in (such as standard scores of 55) recognizing that we do not change scores on the other end (since the rationale does not extend to that group)? (2) if this is statistically sound, are there citations or papers you could share so we could refer to them? (3) if this is statistically sound, would you recommend that we use the same score across standardized tests (e.g., 55), or look up the exact lowest possible standard score for each person based on their age and subtest?
My first suggestion is "don't take advice from random people on the internet." Work with a trusted statistician at your institution.
1. No, what you propose is not Winsorization. It is called "single imputation of missing values," where you are substituting the minimum observed value for the missing value.
2. There are many papers for single imputation. I do not recommend its use for the same reasons that I do not recommend mean-value imputation.
Thanks for taking the time to respond! You have great resources and I've been learning a lot. I actually *did* get the advice from a senior statistician to use the approach I mentioned who works often with clinical scientists and has seen the method used in published work and among colleagues. I look forward to learning more about different approaches by different researchers to find the best approach. I can cross off Winsorization from the list of options!
Thanks for the article! How would you then handle an extremely right-skewed dataset with several close to zero but nonzero observations?
It depends on the scientific question you want to answer. If I wanted to model it parametrically, I would look at a gamma distribution.
A survey of sampling from contaminated distributions" (1960), Tukey
Is this article available online?
I don't know. The article is from a collection of essays.
Tukey, J. W. (1960). A survey of sampling from contaminated distributions. Contributions to Probability and Statistics: Essays in Honor of Harold Hotelling. Stanford University Press, Stanford, 448-485.