This article shows how to visualize a surface in SAS. You can use the SURFACEPLOTPARM statement in the Graph Template Language (GTL) to create a surface plot. But don't worry, you don't need to know anything about GTL: just copy the code in this article and replace the names of the data set and variables.
In some situations, you don't have to write any code because some SAS procedures create surface plots automatically. For example, the RSREG procedures produces surface plots that are quadratic regression surfaces. The KDE procedure produces surfaces for bivariate density estimates.
An alternative to plotting a surface is to use a contour plot. For many situations a contour plot is ideal, and you never need to worry that a ridge in the foreground of a surface will hide details of a valley behind the ridge. Many SAS procedures (GLM, KRIGE, PLM,...) create contour plots automatically when it is appropriate.
Creating a surface plot in SAS with ODS graphics: The template
Use the GTL to create a surface plot. This section describes how to define a graph template for a surface plot. The next section shows how to display the plot by using the SGRENDER procedure.
The following template is adapted from the documentation for the SURFACEPLOTPARM statement, which explains various options for visualizing the surface:
proc template; /* surface plot with continuous color ramp */ define statgraph SurfaceTmplt; dynamic _X _Y _Z _Title; /* dynamic variables */ begingraph; entrytitle _Title; /* specify title at run time (optional) */ layout overlay3d; surfaceplotparm x=_X y=_Y z=_Z / /* specify variables at run time */ name="surface" surfacetype=fill colormodel=threecolorramp /* or =twocolorramp */ colorresponse=_Z; /* prior to 9.4m2, use SURFACECOLORGRADIENT= */ continuouslegend "surface"; endlayout; endgraph; end; run; |
The template describes the layout for a surface plot. Instead of hard-coding the names of variables, the template uses dynamic variables so that you can reuse the template for many different data sets. The dynamic variables (and the title) are assigned values when you use the SGRENDER procedure to render the graph.
You only need to run the previous statements once. The statements create a template called SurfaceTmplt. Whenever you want to create a surface, simply use PROC SGRENDER, as shown in the next section.
Creating a surface plot in SAS: The rendering
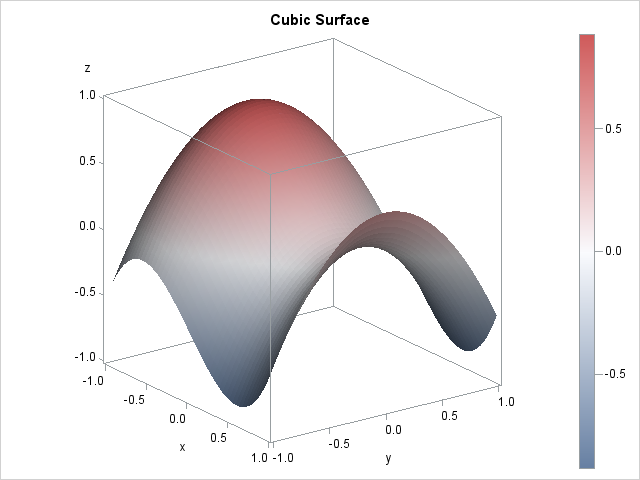
To use the template, you need to have values for the surface on a grid of (x,y) locations. The following DATA step generates values for a cubic function of two variables that I previously used to construct heat maps. The surface plot of this function is shown at the top of this article.
/* sample data: a cubic function of two variables */ %let Step = 0.04; data A; do x = -1 to 1 by &Step; do y = -1 to 1 by &Step; z = x**3 - y**2 - x + 0.5; output; end; end; run; proc sgrender data=A template=SurfaceTmplt; dynamic _X='X' _Y='Y' _Z='Z' _Title="Cubic Surface"; run; |
For this surface, the COLORMODEL=threecolorramp option was used to color the surface according to a three-color spectrum of colors. For other surfaces, a two-color spectrum (COLORMODEL=twocolorramp) might be more appropriate.
Most of the time you have data that is already arranged on a grid of (x, y) values. If you have irregularly spaced data, you can use your favorite regression procedure to fit a surface to the data, then use the PLM procedure to score the model on a regular grid of points. You can download a SAS program that analyzes irregularly spaced data and scores a regression model on a regular grid so that the surface can be visualized. Alternatively, if you have SAS/GRAPH software, you can use the G3GRID procedure to interpolate the values onto a regular grid.

10 Comments
Pingback: The famous SAS cowboy hat now fits all SAS users - The SAS Dummy
Rick,
Runned your code, and Got Error Information :
ERROR: FILE “WORK.SCOREXY.DATA” DOES NOT EXIT .
Thanks. Fixed.
See the error produced by your template below. Thoughts here? Thanks!
colorresponse=_Z; /* produces an error */
-------------
22
76
ERROR 22-322: Syntax error, expecting one of the following: ;, COLORMODEL, DATATRANSPARENCY,
FILLATTRS, LEGENDLABEL, NAME, PRIMARY, REVERSECOLORMODEL, SURFACECOLORGRADIENT,
SURFACETYPE.
ERROR 76-322: Syntax error, statement will be ignored.
You must be using a version of SAS prior to 9.4m2. Use SURFACECOLORGRADIENT=_Z;
Greeting Sir
I need hand to plot 3 D surface. I run Multiple regression and get the equation but I don;t know how to plot 3 D surface for these data. Thanks in advance
You can post your data and question to the SAS Statistics Support Community and one of the experts there will help you.
Do you know how can I increase the font size?
You can post your question and code to the Graphics Support Community. The answer depends on how you are creating the graph (PROC KDE, straight GTL,...) and which text you are trying to change (ticks, labels, titles,....) The general way is to modify the ODS style, but often there are multiple ways to do things.
layout overlay3d/
zaxisopts=(griddisplay=on labelattrs=(size=12) TICKVALUEATTRS=(size=12)
LINEAROPTS=(TICKVALUELIST=(0 20 40 60 80 100) TICKVALUEPRIORITY=TRUE))
xaxisopts=(griddisplay=on labelattrs=(size=12) TICKVALUEATTRS=(size=12))
yaxisopts=(griddisplay=on labelattrs=(size=12) TICKVALUEATTRS=(size=12));
Done! A lot of thanks...