In a previous post I described how to simulate random samples from an urn that contains colored balls. The previous article described the case where the balls can be either of two colors. In that csae, all the distributions are univariate. In this article I examine the case where the urn contains c > 2 colors, which leads to multivariate distributions.
Let K1, K2, ..., Kc be the number of balls for each of the c colors. Let N = Σ Ki be the total number of balls.
The table distribution
The simplest experiment is to reach into the urn and pull out a single ball. The probability of choosing a ball of color i is pi = Ki / N. In SAS you can use the table distribution to specify the probabilities of selecting each integer in the range [1, c]. Some people call the table distribution a categorical distribution or a generalized Bernoulli distribution.
You can use the RAND function in the DATA step to simulate from a categorical distribution. You can also use the RANDGEN function in SAS/IML software, or you can use the SAMPLE function.
The multinomial distribution
If you repeat the experiment n times (replacing the selected ball after recording its value), you obtain a c-tuple of counts. Let ki be the number of times that a ball of color i was selected. Then the result of n draws with replacement is the vector (k1, k2, ..., kc) where Σ ki = n.
By definition, this c-tuple is a single draw from the multinomial distribution. In SAS, you can use the RANDMULTINOMIAL function in SAS/IML to simulate from the multinomial distribution.
The multivariate hypergeometric distribution
When sampling with replacement, the probability of choosing a ball of color i never changes. However, you can also sample without replacement. Without replacement, the probability of choosing a given color changes from draw to draw.
The distribution of the number of colored balls when you sample without replacement is called the multivariate hypergeometric distribution. SAS does not have a built-in function for simulating data from a multivariate hypergeometric distribution, but the following programs shows that you can iteratively use the univariate hypergeometric distribution to construct a multivariate function.
A standard technique for drawing a sample from multiple categories is to reduce the problem to a series of two-category problems by combining colors (Gentle, 2003, p. 206). You can obtain a random number of balls drawn from the first color category by using the hypergeometric distribution with K1 balls of the first color and N - K1 balls in the "other" category. Suppose that k1 balls of the first color are selected. For the second step, there are N - K1 balls of the other colors in the urn and n - k1 balls left to draw. Repeat this process with the second color category. Use the hypergeometric distribution to draw k2 balls of the second color. That leaves (N - K1 - K2) balls of the remaining colors in the urn and (n - k1 - k1) balls left to draw. Continue this process to obtain counts for all the categories.
The following SAS/IML function can return multiple draws from the multivariate hypergeometric distribution. The function is efficient because it exploits the fact that you can pass vectors of parameters to the RANDGEN subroutine. The RandMVHyper function uses a vector of N's (ItemsLeft) and a vector of n's (nDraw) to generate an arbitrary number of independent draws from the multivariate hypergeometric distribution. There is no loop over the number of replications. The only loop is over the number of colors, which is necessary because that loop updates the selection probabilities. (If you study the code, you might want to mentally set nRep = 1 so that the vectors of parameters become scalar quantities.)
proc iml; /* There are K[i] balls of color i in an urn. Draw N balls without replacement and report the number of each color. N[1] = sample size N[2] = number of replications (optional. Default is 1) K = vector that gives the number balls of each color. The total number of balls is sum(K). */ start RandMVHyper(N, _K); if nrow(N)*ncol(N)>1 then nRep = N[2]; else nRep = 1; K = rowvec(_K); /* K[i] is number of items for category i */ nDraw = j(nRep, 1, N[1]); /* run nRep sims at once */ ItemsLeft = j(nRep, 1, sum(K)); x = j(nRep, ncol(K), 0); /* each row is draw from MV hyper */ h = j(nRep, 1, 0); /* vec for hypergeometric values */ do i = 1 to ncol(K)-1; Kvec = j(nRep, 1, K[i]); call randgen(h, "Hyper", ItemsLeft, Kvec, nDraw); x[,i] = h; ItemsLeft = ItemsLeft - K[i]; /* update parameters */ nDraw = nDraw - h; end; x[,ncol(K)] = nDraw; return (x); finish; call randseed(1234); /* TEST: nDraws nRep K1 K2 K3 */ y = RandMVHyper({100 1000}, {100 40 60}); print (y[1:5,])[c={"black" "white" "red"} L="Draws w/o Replacement"]; mean = mean(y); print mean; |
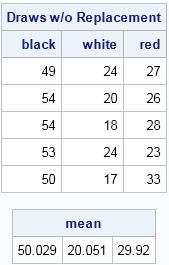
The test code requests 1,000 replicates. Each replicate is a random vector from the multivariate hypergeometric distribution, namely the result of drawing 100 balls without replacement from an urn that contains 100 black balls, 40 white balls, and 60 red balls. The table shows the first five results. For example, the fourth experiment resulted in 53 black, 24 white, and 23 red balls. Each row sums to 100, which is the number of balls drawn for each experiment. The average counts from the 1,000 experiments were approximately 50 black ball, 20 white balls, and 30 red balls. These are the expected values.
The RandMVHyper function handles most cases, but it can break down when the sample size is small and when some categories (colors) have small marginal sums. You can download a more robust version of the function that handles these edge cases.
In summary:
- Use the table (generalized Bernoulli) distribution to simulate drawing a colored ball from an urn that contains balls of different colors.
- Use the multinomial distribution to generate the counts when you sample n balls with replacement. In other words, you repeat n independent and identical generalized Bernoulli trials and tabulate the number of balls that were selected for each color.
- Use the multivariate hypergeometric distribution to generate the counts when you sample n balls without replacement. This article contains a SAS/IML function that samples from the multivariate hypergeometric distribution.

3 Comments
Simply excellent! I look forward to your posts all the time.
Cheers
Pingback: Simulate from the multinomial distribution in the SAS DATA step - The DO Loop
Excellent Rick.
Your enhanced more robust code encounters an error when the balls' freq count is highly skewed and has large values like for example {5000 10 200}.
Then the second color in my example gets assigned all 0 for each trial.
To fix it, I've reset the idx_ vectors just after entering the do loop and now it works.
do i = 1 to ncol(K)-1;
idx=.;
idx0=.;
idx1=.;
...