O Christmas tree,
O Christmas tree,
One year a fractal made thee!
O Christmas tree,
O Christmas tree,
A heat map can display thee!
From Pascal's matrix we define!
Reflect across, divide by nine.
O Christmas tree,
O Christmas tree,
Self-similar and so divine!
Eventually I will run out of cute ways to use SAS software to create and visualize a Christmas-themed image. But not this year!
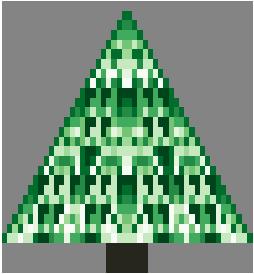
My recent article about how to create Pascal's matrix in SAS included a lower triangular matrix that exhibits self-similar patterns. If you take the Pascal matrix modulo 9 and reflect it across the Y axis, you get a triangular array that looks a little bit like a Christmas tree. You can add a "trunk" to the bottom of the tree to improve the resemblance. As shown in my previous post, you can use a heat map to visualize the matrix. In the following SAS/IML program, I use a green palette of colors to visualize the Pascal triangle values modulo 9. The resulting heat map is shown at the top of this article.
proc iml;
start PascalRule(n);
   m = j(n,n,0);              /* initialize with zeros */
   m[,1] = 1;                 /* set first column to 1 */
   j = 2:n;                   /* elements to compute */
   do k = 2 to n;
      /* for kth row, add adjacent elements from previous row */
      m[k,j] = m[k-1,j-1] + m[k-1,j];
   end;
   return(m);
finish;

/* reflect Pascal's triangle to create left-right symmetry
   and add a tree trunk to create a Christmas tree image */
start PascalTree(n);
   m = PascalRule(n);
   T = m[,n:2] || m[,2:n];    /* reflect; omit column of 1s */
   T[ loc(T=0) ] = .;         /* replace zeros with missing values */
   trunk = j(3,ncol(T),.);    /* add a "tree trunk" with value -1 */
   midpt = ncol(T)/2;         /* note that ncol(T) is even */
   halfwidth = ceil(n/10);
   trunk[,(midpt-halfwidth):(midpt+halfwidth+1)]= -1;
   return( T // trunk );
finish;

m = PascalTree(25);
k = 9;
tree = mod(m,k);

ods graphics / width=300px height=380px;
title = "Happy Holidays to All SAS Users!";
ramp = palette("greens", k);
ramp = "CX26261C" || ramp[,k:1];  /* brown (for trunk) and green palette */
call heatmapdisc(tree) colorramp=ramp displayoutlines=0 title=title; |
It is remarkable that the Pascal matrix has so many amazing mathematical properties. Now you can add "makes a reasonable facsimile of a Christmas tree" to the list!
Happy holidays and a wonderful New Year to all of my readers. You are the reason that I write this blog.

4 Comments
Hi,
Have you done any work on Power Transformations either using PROC IML or otherwise?
Regards
Jon Dickens
Yes. I wrote various transformations for SAS/IML Studio. For IML details, look at this SUGI 22 paper by Dimakos or the %BOXCOX macro by Friendly. You can also use the BOXCOX transformation in PROC TRANSREG for transformations in regression models.
Happy Holiday Rick.
There is a hidden X'mas tree from the parallel-view. Amazing!!
stupid! (just kidding: great!)