I enjoy reading the Graphically Speaking blog because it teaches me a lot about ODS statistical graphics, especially features of the SGPLOT procedure and the Graph Template Language (GTL). Yesterday Sanjay blogged about how to construct a stacked bar chart of percentages so that each bar represents 100%. His chart had the additional feature of displaying the percentages for each category. His post showed how to use the SGPLOT procedure to duplicates the functionality of the G100 option in the GCHART procedure.
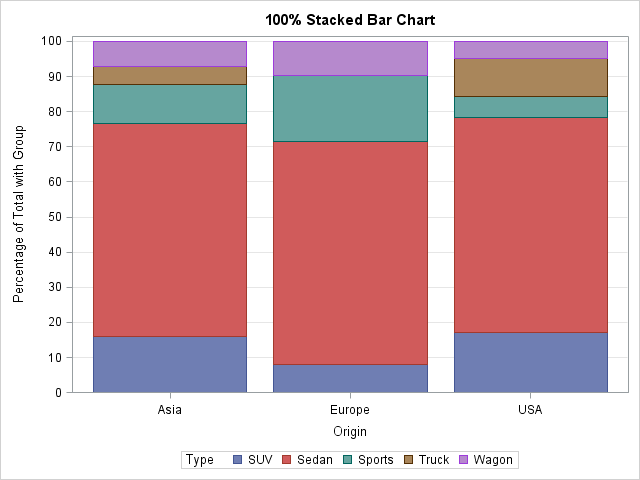
In this blog post I present an alternative to Sanjay's construction. When I construct a stacked bar chart, I use PROC FREQ to compute the percentages of each category within a group. I then use the VBAR or HBAR statements in the SGPLOT procedure to construct the stacked bar chart. For example, the bar chart at the top of this post is constructed by using the following statements:
proc sort data=sashelp.cars(where=(Type^="Hybrid")) out=cars; by Origin; /* sort X categories */ run; proc freq data=cars noprint; by Origin; /* X categories on BY statement */ tables Type / out=FreqOut; /* Y (stacked groups) on TABLES statement */ run; title "100% Stacked Bar Chart"; proc sgplot data=FreqOut; vbar Origin / response=Percent group=Type groupdisplay=stack; xaxis discreteorder=data; yaxis grid values=(0 to 100 by 10) label="Percentage of Total with Group"; run; |
The VBAR statement in the SGPLOT procedure creates the stacked bar chart. Each bar totals 100% because the Percent variable from PROC FREQ is used as the argument to the RESPONSE= option. The GROUPDISPLAY=STACK option stacks the groups so that there is one bar per category.
Creating stacked bars ordered by percentages

A variation of the 100% stacked bar chart is to order the "slices" of the bars by their relative sizes. This is shown at the left. I used the ORDER= option on the PROC FREQ statement to output the counts in descending order for each bar. If I use the GROUPORDER=DATA option on the VBAR statement in PROC SGPLOT, the categories will be arranged and colored according to how they appear in the data. In particular, the first bar will be ordered by relative percentages, as shown by the "Asia" bar. Notice, however, that this does not guarantee that other bars are ordered by size, as seen by the "Europe" bar.
Still, I like to order the groups by size because it makes it easier to find the relative percentages of the most important groups. In general, I prefer to order charts by some quantity, rather than to use the default alphabetical ordering.
The following statements produce the 100% stacked bar chart with ordered groups, assuming that the data set is already sorted according to the X variable:
proc freq data=cars order=freq noprint; /* ORDER= sorts by counts within X */ by Origin; /* X var */ tables Type / out=FreqOutSorted; /* Y var */ run; proc print data=FreqOutSorted; run; title "100% Stacked Bar Chart Ordered by Percentages"; proc sgplot data=FreqOutSorted; vbar Origin / response=Percent group=Type grouporder=data groupdisplay=stack; /* order by counts of 1st bar */ xaxis discreteorder=data; yaxis grid values=(0 to 100 by 10) label="Percentage of Total with Group"; run; |
PROC FREQ does it, too! (SAS 9.4m1)
Over the last few releases there have been quite a few new ODS graphs that come out of PROC FREQ "for free." If you have SAS 9.4m1, you can use the SCALE=GROUPPERCENT option to create a stacked bar chart similar to the one in the previous section:
proc freq data=cars order=freq; tables Type*Origin / plots=freqplot(twoway=stacked scale=grouppct); run; |
The lesson to learn is that you can use relatively simple statements (my post) to produce basic stacked bar charts or more sophisticated SAS code (Sanjay's post) to produce more complicated bar charts. Choose the method that you prefer, and let SAS do the rest.

22 Comments
The SGPLOT VBAR statement can be used to created stacked grouped bars with FREQ statistics. With SAS 9.4, you can also use the PCTLEVEL option on the SGPLOT statement to get the G100 type bar with percent values. However, VBAR usage has some restrictions when it comes to overlaying other plot statements. So, to draw a G100 bar chart with % labels for each segment, we have to do it using a different statement like HIGHLOW bar. See my new blog article on the features of the HIGHLOW bar at http://blogs.sas.com/content/graphicallyspeaking/2014/05/04/the-highlow-plot/
Is there any way to suppress the table that proc freq produces and only output the graph?
Yes. Every ODS table and every ODS graph in SAS has a name. To exclude a table, put the statement
ODS EXCLUDE name_of_table;
before the PROC call. Use the ODS TRACE ON statement to find the name of tables. For this example, you would use
ods exclude CrossTabFreqs;
That worked perfectly! Thanks so much for always being so helpful; I've always enjoyed using the blog as a resource!
Sebastian
Is there a way to produce a set of stacked bars for a set of variables that use the same likert-scale. I'd love to do something like this in SAS:
http://jason.bryer.org/likert/
Thank you!
I see that you have posted this question on SAS-L and are getting responses. If you want to query a larger community of graphics experts, try the SAS Support Community for Graphics
Hi Guys: I am trying to create a stacked horizontal bar graph which stacks over time with (1) Missing (2) Normal, and (3) Abnormal data then sums that using percentages. I can create this graph somewhat but I cant get it to use the % missing as % of the available data at each time point. Sas Missing basically uses missing as its own category and then all %'s are computed using the same N ie Missing+Available=N. Any ideas on how to get the graph I want? I would also like to add labels to the segments within the bar.
This is the code I used from this website. thanks Guys.
proc freq data=longabdata order=freq ;
format step step.;
format asbp100 abnm.;
tables Asbp100*step / missing plots=freqplot(twoway=STACKED ORIENT=Horizontal scale=grouppcnt) ;
run;
Post your question to the SAS Support Communities. There is a dedicated community for SAS/GRAPH and ODS Graphics.
Recently, I've been able to do this using the barchart statement in GTL. By using the GROUP100=MAGNITUDE option. This works fine when executing on my server (Linux). I've learned, however, that when executing local (Windows PC), I get an error\warning:
WARNING 1-322: Assuming the symbol GROUP was misspelled as group100.
The chart renders incorrectly. This is all in 9.4. Not sure why the local server space does this. Not a big deal, as I was only using it as a demo. It sure is a nice feature to have. It works very nice on the servers. Here's a full snippet of the code that works on the server:
barchart category=date_label response=time_span_sec /
group=module groupdisplay=stack orient=vertical
name="sb2" group100=magnitude tipformat=(response=comma12.)
TIP=(group response) TIPLABEL=(group="Module" response="Seconds")
;
I'm charting the execution time (time_span_sec) of the code modules (module) of my daily executions (date_label). This creates a data vis for me to see how my program runs each day for easy debugging :). The 100% allows me to see how each module's execution time compares day by day.
The GROUP100= option was added in SAS 9.4m3 (third maintence release). Clearly your local Windows PC is running an earlier release.
Pingback: High school rankings of top NCAA wrestlers - The DO Loop
I have used this code everything is perfect except for the y axis data point labels..they are taking too much space on the graph..I have values(35mg BD continuous N=6,50mg BD continuous N=13 and so..on and there are 10 doses that go on x-axis,so that will be 10 bars) but these bar labels are taking lots of space in the report..Is there an option where i can force label to flow into next line(35mg BD in first line and then continous in sec line and N+6 into third line)? please help me on this.
Yes, there are ways to do this. See the doc for the YAXIS options, especially the FITPOLICY=SPLIT option. If you still have problems, post to the SAS Support Communities.
split option is available in sas9.4 and i am using sas 9.3
Hi,
I have a query regarding bar chart. In this analysis, we need find out from the year 2007 to 2010, how many times GY1, GY2 and GY3(group names) are ranked in each year (shown as numbers under bars on the graph below). And within each year’s bars we’d also like to know what the proportions are respectively that GY1, GY2 and GY3 are ranked as 1st, 2nd and 3rd (shown as percentages within each bars).
How to accomplish this?
I suggest that you post your question, example data, and what you have attempted to the SAS Support Community for Graphics.
How can I get the N's on the chart for each vertical bar?
You can use the SEGLABEL option on the VBAR statement to add percentages, which are the values being plotted. If that's not what you want, post your question and sample code to the SAS Support Community for Graphics.
Is it possible to turn x-axis tick mark labels vertically? I'm using dates instead of Asia, Europe and USA and need to display them vertically.
You can ask questions like this at the SAS Support Communities. The FITPOLICY= option on the XAXIS statement supports many ways to display the tick mark values. I use the FITPOLICY=ROTATETHIN option a lot.
Hi,
I am running SAS version 9.04.01M8P011823 (SAS Studio)
and it seems 100% Stacked Bar can be directly (one-step) constructed in SGPLOT using pctlevel=group
Yes, correct. For example, the following statements create a stacked bar chart:
The reason I used PROC FREQ was because I wanted to stack the bars in ascending order by frequency, which is not possible by using the above code. If you use the GROUPORDER= option, you can order the bars alphabetically (increasing or descending) or by their order in the data set, but not by the relative proportions of the subcategories.