Like many SAS programmers, I use the Statistical Graphics (SG) procedures to graph my data in SAS. To me, the SGPLOT and SGRENDER procedures are powerful, easy to use, and produce fabulous ODS graphics. I was therefore surprised when a SAS customer told me that he continues to use the old GPLOT procedure because "the procedure makes it easy to add a smoothing spline curve to a scatter plot." The customer likes using smoothing splines, which are produced by using the INTERPOL=SMnn option on the SYMBOL statement. He added that smoothing splines are not available in PROC SGPLOT.
My response: If you like the GPLOT procedure, you are certainly welcome to continue using it. However, if the only reason you use it is to add a spline curve to a scatter plot, you should know that there are alternatives. This article shows how to fit a spline curve by using by using PROC TRANSREG or PROC IML.
Splines, splines, everywhere
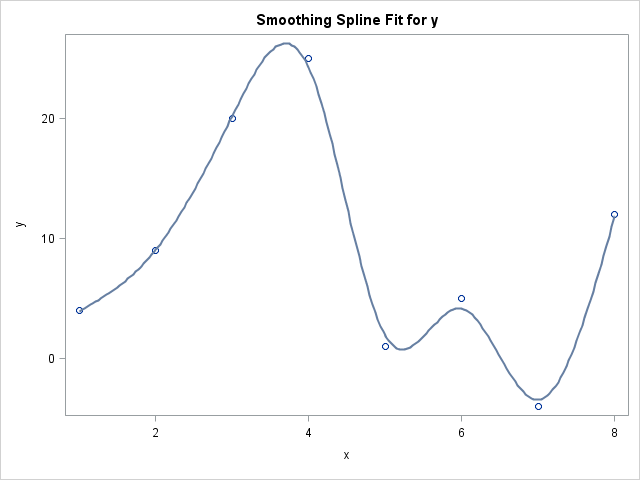
A spline is one way to fit a smooth curve to two-dimensional data. There are actually many kinds of splines. The "smoothing spline" that the customer likes is a cubic spline, but SAS supports thin-plate splines and penalized B-splines, just to name two others. Let's see what a spline curve looks like as created by PROC GPLOT and the SYMBOL INTERPOL=SMnn option:
/* data set A must be sorted by x */ data A; input x y @@; datalines; 1 4 2 9 3 20 4 25 5 1 6 5 7 -4 8 12 ; title "sm45 spline smoother"; proc gplot data=A; plot y*x; symbol1 interpol=sm45 value=circle height=2; /* note that x is sorted */ run; |

The graph displays a scatter plot overlaid with a spline smoother. In the SYMBOL statement, the last two digits of the INTERPOL=SM option specify the amount of smoothness in the spline curve. A value close to zero results in a curve with many wiggles that nearly passes through every data point. A value close to 100 results in a flat curve that is nearly the least-squares regression line for the data. Many examples that I have seen use smoothing values in the range 40–60.
Computing a spline curve by using the TRANSREG procedure
The easiest way to generate an ODS graph that shows the same curve is to use the TRANSREG procedure in SAS/STAT software. The TRANSREG procedure supports a SMOOTH transformation of an explanatory variable. The SM= option enables you to specify a smoothing value in the range [0, 100], which is the same range as for PROC GPLOT.
Because there are only eight observations, a plot of the predicted values versus the explanatory variable will look jagged. To see a smooth curve of predicted values, you can evaluate the spline curve at a series of evenly spaced points within the range of X. The TRANSREG function does not support a SCORE or STORE statement, but you can use the missing response trick to visualize the spline curve. The following DATA step creates 200 evenly spaced points in the range [1, 8]. A second DATA step concatenates the original data and the evenly spaced points:
/* the scoring data; evaluate model on these values */ %let NumPts = 200; data ScoreX(keep=x); min=1; max=8; do i = 0 to &NumPts-1; x = min + i*(max-min)/(&NumPts-1); /* evenly spaced values */ output; /* no Y variable; only X */ end; run; /* concatenate the original data and the scoring data */ data B; set A ScoreX; run; /* use the missing response trick to evaluate the spline on the scoring data */ proc transreg data=B plots(interpolate); model identity(y) = smooth(x / sm=45); output out=Pred p; /* optional: write spline curve to a data set */ run; |
The spline curve produced by PROC TRANSREG is identical to the smoothing spline that is produced by PROC GPLOT. The OUTPUT statement in the TRANSREG procedure enables you to write the values from the spline curve to a SAS data set, which means that you can also use PROC SGPLOT to create this graph.
Computing a spline curve in SAS/IML
SAS/IML software computes smoothing splines by using the SPLINE subroutine. The routine enables you to compute interpolating splines, smoothing splines, and parametric splines, and to control the behavior of the curves at the endpoints of the curves. However, the SPLINE routine uses a different parameterization than the GPLOT and TRANSREG procedures.
In the SPLINE subroutine, the parameter that controls the smoothing can be any nonnegative value. The parameter is a geometric transformation of the SM= value in PROC TRANSREG, which means that you can specify the smoothing parameter from GPLOT and convert it into the corresponding parameter for the SPLINE routine. Specifically, the following SAS/IML statements compute a smoothing spline for the data:
proc iml;
  use A;  read all var {x y};  close A;   /* read data */

  /* supply the smoothing parameter value from the SYMBOL statement */
  sm = 45;                          /* value in the INTERPOL=SM option         */
  ssd = ssq(x-mean(x));             /* sum of squared deviations from the mean */
  t = ssd##1.5 / (10##(9-(sm*.1))); /* SPLINE parameter as a function of SM    */

  /* fit the spline and get interpolated points */
  call spline(fitted, x||y) smooth=t;
  create SplineFit from fitted[c={x p}];
  append from fitted;
quit;

/* concatenate with original data */
data C;
  set A SplineFit(rename=(x=copyX));
run;

proc sgplot data=C;
   title "Spline from SPLINEC routine in SAS/IML";
   scatter x=x y=y;
   series x=copyX y=p;
run; |
The values produced by PROC IML are identical to the spline values that were computed by PROC TRANSREG. PROC SGPLOT produces a graph (not shown) that is nearly identical to the graph that was produced by PROC TRANSREG. In conclusion, there are two easy ways to compute smoothing splines outside of PROC GPLOT.
Are there other features of PROC GPLOT that are unsupported by PROC SGPLOT and that you can't live without? In the comments, tell me your favorite feature of PROC GPLOT that prevents you from switching to PROC SGPLOT.
Other ways to smooth a scatter plot
One last comment on splines. I've shown that you can create a smoothing spline with PROC GPLOT, PROC TRANSREG, or the SPLINE subroutine in PROC IML. However, from a statistical point of view, the smoothing spline is less than ideal because the smoothing parameter must be chosen manually by the user. My next blog post describes how to add smoothing curves whose parameters are chosen automatically to optimize a statistical criterion.

9 Comments
Cool stuff and I look forward to your next post.
At SGF I am giving a talk on scatterplots and it includes adding a Loess curve in SGPLOT (and also in SGRENDER) but it doesn't use IML at all
Pingback: How to automatically select a smooth curve for a scatter plot in SAS - The DO Loop
"The TRANSREG function does not support a SCORE or STORE statement, but you can use the missing response trick to visualize the spline curve."
Is this to say that the SMOOTH and SSPLINE options are very pretty but can't actually be used for predicting future observations? I tried SPLINE and was able to predict the next observation adding an observation that only contained the dependent variable, and the numbers were different from the last observation with actual data. I changed to SMOOTH or SSPLINE, and the numbers are always the last known values. Any idea if this has been changed in 9.2 or higher? If not, is there a trick to get a value in a dataset rather than just see it on a chart? It would be great to see what the SSPLINE and SMOOTH predict the next observations to be, but I haven't found a PREDICTED option or SCORE option that seems to work with these two options. Thanks in advance for any input...
The phrase "the missing response trick" links to an article that explains how to get the output. Like other SAS regression procedure, TRANSREG supports the OUTPUT statement , whic you can use to output predicted values, residual values, and more. The most basic usage is:
OUTPUT out=MyOutput predicted;
Sorry, I didn't clarify well in my comment... the missing value trick results in the last observation's predicted value being repeated. Here's an example:
PROC TRANSREG DATA=DS1;
MODEL IDENTITY(N1) = SSPLINE(_ROW);
OUTPUT PREDICTED OUT=PRED;
RUN;
If the last observation of N1 is 13 and _row is 5, I can add a record with a _row value of 6 (leaving N1 blank) but the N1 value predicted will be 13. This happens every time and I can't seem to figure out a way to make it predict a different value. This also seems to happen with the SMOOTH option.
The comment section of a blog post is not an effective place to exchange code and ask questions. Please post your coding questions to the SAS Support Community for statistical procedures. Be sure to include sample data that shows the issue.
Pingback: On the SMOOTHCONNECT option in the SERIES statement - The DO Loop
I like that spline line you plotted through the data.
Is it possible to plot a moving average through the data points?
Thanks,
DE
You can compute the moving average in various ways. See the article "Compute a moving average in SAS" for several options.