My previous post described how to use the "missing response trick" to score a regression model. As I said in that article, there are other ways to score a regression model. This article describes using the SCORE procedure, a SCORE statement, the relatively new PLM procedure, and the CODE statement.
The following DATA step defines a small set of data. The goal of the analysis is to fit various regression models to Y as a function of X, and then evaluate each regression model on a second data set, which contains 200 evenly spaced X values.
/* the original data; fit model to these values */ data A; input x y @@; datalines; 1 4 2 9 3 20 4 25 5 1 6 5 7 -4 8 12 ; /* the scoring data; evaluate model on these values */ %let NumPts = 200; data ScoreX(keep=x); min=1; max=8; do i = 0 to &NumPts-1; x = min + i*(max-min)/(&NumPts-1); /* evenly spaced values */ output; /* no Y variable; only X */ end; run; |
The SCORE procedure
Some SAS/STAT procedures can output parameter estimates for a model to a SAS data set. The SCORE procedure can read those parameter estimates and use them to evaluate the model on new values of the explanatory variables. (For a regression model, the SCORE procedure performs matrix multiplication: you supply the scoring data X and the parameter estimates b and the procedure computes the predicted values p = Xb.)
The canonical example is fitting a linear regression by using PROC REG. You can use the OUTEST= option to write the parameter estimates to a data set. That data set, which is named RegOut in this example, becomes one of the two input data sets for PROC SCORE, as follows:
proc reg data=A outest=RegOut noprint; YHat: model y = x; /* name of model is used by PROC SCORE */ quit; proc score data=ScoreX score=RegOut type=parms predict out=Pred; var x; run; |
It is worth noting that the label for the MODEL statement in PROC REG is used by PROC SCORE to name the predicted variable. In this example, the YHat variable in the Pred data set contains the predicted values. If you do not specify a label on the MODEL statement, then a default name such as MODEL1 is used. For more information, see the documentation for the SCORE procedure.
The SCORE statement
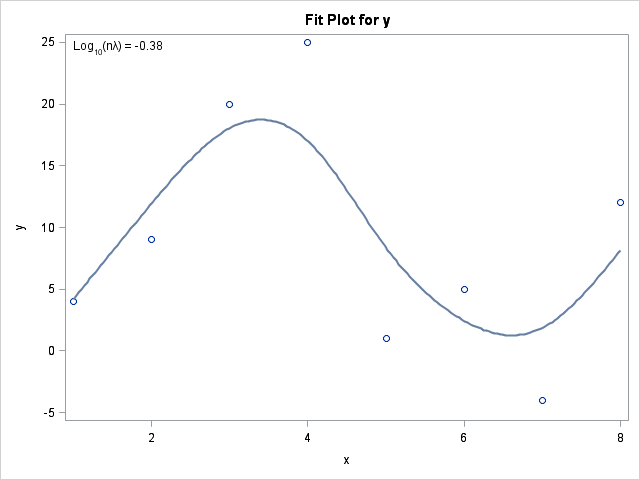
Nonparametric regression procedures cannot output parameter estimates because...um...because they are nonparametric! Nonparametric regression procedures support a SCORE statement, which enables you to specify the scoring data set. The following example shows the syntax of the SCORE statement for the TPSPLINE procedure, which fits a thin-plate spline to the data:
proc tpspline data=A; model y = (x); score data=ScoreX out=Pred; run; |
Other nonparametric procedures that support the SCORE statement include the ADAPTIVEREG procedure (new in SAS/STAT 12.1), the GAM procedure, and the LOESS procedure.
The STORE statement and the PLM procedure
Although the STORE statement and the PLM procedure were introduced in SAS/STAT 9.22 (way back in 2010), some SAS programmers are still not aware of these features. Briefly, the idea is that sometimes a scoring data set is not available when a model is fit, so the STORE statement saves all of the information needed to recreate and evaluate the model. The saved information can be read by the PLM procedure, which includes a SCORE statement, as well as many other capabilities. A good introduction to the PLM procedure is Tobias and Cai (2010), "Introducing PROC PLM and Postfitting Analysis for Very General Linear Models."
For this example, the GLM procedure is used to fit the data. Because of the shape of the previous thin-plate spline curve, a cubic model is fit. The STORE statement is used to save the model information in an item store named WORK.ScoreExample. (I've used the WORK libref, but use a permanent libref if you want the item store to persist across SAS sessions.) Many hours or days later, you can use the PLM procedure to evaluate the model on a new set of data, as shown in the following statements:
proc glm data=A; model y = x | x | x; store work.ScoreExample; /* store the model */ quit; proc plm restore=work.ScoreExample; score data=ScoreX out=Pred; /* evaluate the model on new data */ run; |
The STORE statement is supported by many SAS/STAT regression procedures, including the GENMOD, GLIMMIX, GLM, GLMSELECT, LIFEREG, LOGISTIC, MIXED, ORTHOREG, PHREG, PROBIT, SURVEYLOGISTIC, SURVEYPHREG, and SURVEYREG procedures. It also applies to the RELIABILITY procedure in SAS/QC software.
The CODE statement
In SAS/STAT 12.1 the CODE statement was added to several SAS/STAT regression procedures. It is also part of the PLM procedure. The CODE statement offers yet another option for scoring data. The CODE statement writes DATA step statements into a text file. You can then use the %INCLUDE statement to insert those statements into a DATA step. In the following example, DATA step statements are written to the file glmScore.sas. You can include that file into a DATA step in order to evaluate the model on the ScoreX data:
proc glm data=A noprint; model y = x | x | x; code file='glmScore.sas'; quit; data Pred; set ScoreX; %include 'glmScore.sas'; run; |
For this example, the predicted values are in a variable called P_y in the Pred data set. The CODE statement is supported by many predictive modeling procedures, such as the GENMOD, GLIMMIX, GLM, GLMSELECT, LOGISTIC, MIXED, PLM, and REG procedures in SAS/STAT software. In addition, the CODE statement is supported by the HPLOGISTIC and HPREG procedures in SAS High-Performance Analytics software.
In summary, there are many ways to score SAS regression models. For PROC REG and linear models with an explicit design matrix, use the SCORE procedure. For nonparametric models, use the SCORE statement. For scoring data sets long after a model is fit, use the STORE statement and the PLM procedure. For scoring inside the DATA step, use the CODE statement. For regression procedures that do not support these options (such as PROC TRANSREG) use the missing value trick from my last post.
Did I leave anything out? What is your favorite technique to score a regression model? Leave a comment.

22 Comments
Hi Rick,
Nice job! I haven't been using proc plm so this will motivate me to start using it. Does adding a "by" group change this much? That's one of the areas that I find R MUCH more confusing than SAS.
Cheers,
Bob
From Tobias and Cai (2010): "When you use a BY statement in the analysis that creates an item store,
the information about BY variables and BY-group-specific modeling results is also transferred to the item store, and
PROC PLM also automatically processes the item store in BY-group order."
Great blog post, I think you're right about people not being aware of PROC PLM and code statement... Whilst SAS code written years ago still works, enhancing it can give you time and resource benefits. These features you've succinctly highlighted will certainly help.
Nice post, Rick! I had not tried proc PLM yet, and will give it a spin.
Pingback: Three ways to add a smoothing spline to a scatter plot in SAS - The DO Loop
I have been testing the new Visual Statistics for a few months and one of my tasks was to verify the CODE output from PROC IMSTAT from the lasr genmodel, glm, and logistic actions. I really like this output because it contains all the information for scoring, but having the explicit code to run as a data step allows me to modify it on the fly. The header for the code also contains useful information that I may have forgotten since the time I fit the model.
Let's say I've divided my analysis data into 10 cross-validation subsets, identified as k=1 thru 10. I'd like to train proc reg on 9 of the subsets and then score the 10th validation subset (and then repeat the procedure for each of the other 9 training datasets). However proc score won't allow me to score a subset of the analysis dataset as follows:
proc reg data=A outest=RegOut noprint;
where k<10;
model y = x;
quit;
proc score data=A score=RegOut type=parms predict out=Pred;
where k=10;
var x;
run;
Is there a simple way to do this without having to create separate validation daatsets? Thanks!
See http://altons.github.io/sas/2013/05/22/cross-validation-using-sas/
Can PLM provide prediction intervals for predictions at new data points for a model fit with GLIMMIX? My application uses a logistic GLMM with one random effect.
See the doc for the SCORE stmt in PROC PLM, which includes this statement: "Prediction limits (LCL, UCL) are available only for statistical models that allow such limits, typically regression-type models for normally distributed data with an identity link function." If the doc isn't clear, you can discuss statistical procedures at the SAS Support Community.
Pingback: Plot the conditional distribution of the response in a linear regression model - The DO Loop
Pingback: Generate evenly spaced points in an interval - The DO Loop
Pingback: Create a surface plot in SAS - The DO Loop
Thanks for this, Rick! I'm trying to use this with the TRANSREG procedure, and just can't make it work. Have you tried it with that procedure?
The last paragraph says, "For regression procedures that do not support these options (such as PROC TRANSREG) use the missing value trick from my last post." If you have specific questions about syntax, please post to the SAS Support Communities.
Pingback: Use the EFFECTPLOT statement to visualize regression models in SAS - The DO Loop
Nice post as usual!
Is there a way to add the prediction graphics that PROC REG produces to PROC SCORE?
Thanks
Although PROC SCORE will not go away, PROC PLM is the modern way to do post-fitting analysis such as scoring. PROC PLM can produce a wide variety of ODS graphics, including prediction graphics, by using the EFFECTPLOT statement. You can get contour plots, fit plots, sliced plots, and more. For examples, see the article "Use the EFFECTPLOT statement to visualize regression models in SAS."
Pingback: 3 ways to visualize prediction regions for classification problems - The DO Loop
I would like to ask the same question about transreg: how do I get the predicted value Y instead of predicted transformed Y?
The example below shows a mspline transformation on Y. SAS will show the predicted transformed Y, denoted as PY. How do I get predicted Y based on PY?
data x;
do i = 1 to 5000;
w = normal(7);
x = normal(7);
z = normal(7);
y = w * w + log(5 + x) + sin(z) + normal(7);
output;
end;
run;
proc transreg data=x solve details ss2;
ods output splinecoef=c;
model mspline(y /nknots=9) = spline(w x z / knots=-1.5 to 1.5 by 0.5
exknots=-5 5);
output out=d predicted;
run;
Hi can you tell me the syntax of scoring the PHREG model..i have difficulty figuring that out!
Please help!
Sure. Post your question along with your PHREG syntax to the SAS Support Community and someone will help you.