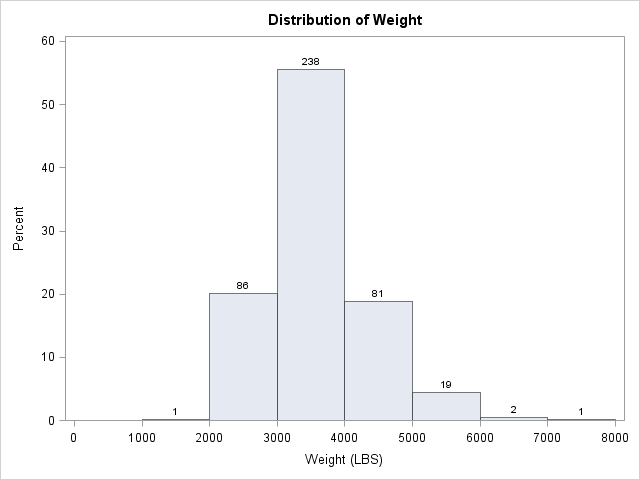
It is often useful to partition observations for a continuous variable into a small number of intervals, called bins. This familiar process occurs every time that you create a histogram, such as the one on the left. In SAS you can create this histogram by calling the UNIVARIATE procedure. Optionally, if you want to create a data set that contains the count of the observations in each bin, you can use the OUTHIST= option as shown in the following statements:
ods select Histogram; proc univariate data=sashelp.cars; var Weight; histogram Weight / endpoints=(0 to 8000 by 1000) barlabel=count outhist=BinCount; run; /* proc print data=BinCount; run; */ /* optional print */ |
The end points of the bins are called the cut points. In the histogram, the cut points are evenly spaced: 0, 1000, 2000, ..., 8000. The nine cut points define eight bins of equal width. For the Sashelp.Cars data, no vehicle weighs less than 1000 pounds, so the first bin is empty.
Two related tasks are not supported by the UNIVARIATE procedure: finding the bin number for each observation, and using unequally spaced bins. You could write a DATA step for both these tasks, but SAS/IML language provides the BIN function, which is simpler to use. (The BIN function was introduced in SAS/IML 9.3.) The following example uses the same Sashelp.Cars data:
proc iml;
use sashelp.cars;
read all var {Weight} into x;
close sashelp.cars;

cutpts = do(0, 8000, 1000);
b = bin(x, cutpts); /* i_th element is 1-8 to indicate bin */ |
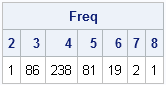
The b vector indicates to which bin each observation belongs. The value of b[i] is j when x[i] is in the jth bin. If desired, you can use that information to tabulate the counts in each bin, thus creating a tabular version of the histogram:
call tabulate(BinNumber, Freq, b); print Freq[colname=(char(BinNumber,2))]; |
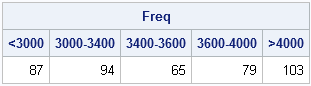
The HISTOGRAM statement in PROC UNIVARIATE does not permit you to use unevenly spaced bins, but the BIN function does. In fact, the BIN function supports two special missing values. The special SAS missing value .M is interpreted as "negative infinity" and the missing value .I is interpreted as "positive infinity." An interval of the form (.M 3000) means "all observations less than 3000" and an interval of the form [4000 .I) means "all observations greater than or equal to 4000." For example, the following cut points define two semi-infinite intervals and three other unevenly spaced bins. A call to the BIN function assigns each observation to the correct bin.
cutpts = {.M 3000 3400 3600 4000 .I};
r = bin(x, cutpts);

call tabulate(BinNumber, Freq, r);
lbls = {"< 3000" "3000-3400" "3400-3600" "3600-4000" "> 4000"};
print Freq[colname=lbls]; |
As I have shown previously, you can use the BIN function in conjunction with the QNTL function to group observations based on quantiles.

8 Comments
Pingback: A simple implementation of two-dimensional binning - The DO Loop
Pingback: Counting observations in two-dimensional bins - The DO Loop
Hi,
I want to make a histogram with uneven bins and I followed the code you used above that outputs the frequencies. Is there a way to make that into a graph? I'm completely new to SAS so any advice you can give me would be much appreciated!
Best,
Sara
Most statisticians (for example, Silverman (1986), "Density Estimation") define histograms as the counts of fixed-width bins. To create a graph of the number of counts for unequal bins, it is best to use a bar chart. If you have already run the code in this blog, you can create the bar chart by running
call bar(lbls) freq=Freq;
Outside of SAS/IML, you can use PROC FORMAT to define a format and then use PROC FREQ to tabulate the data and draw the bar chart. If you don't know how to use PROC FORMAT or PROC FREQ, post a question to the SAS Statistical Procedures Community.
Thank you!
Pingback: The essential guide to binning in SAS - The DO Loop
Hi Rick,
Thanks for your article - very clear and helpful :) I am wondering how can I create a new data table with a column indicating the bin with my custom cutoff points.
For example, I have a mapping table whose structure looks like below
Variable LowerBound UpperBound Bin
X 0.2 1.7 1
X 1.8 3.2 2
X 3.3 7.4 3
Do you know how can I create a new column in my original dataset that segment variable X based on my custom lower and upper bound? Thanks!
Yes, but you must modify the table so that the UpperBound of the previous bin equals the LowerBound of the next bin. Otherwise, you will not correctly handle values such as x=1.75.
For example, you can choose 1.75 as the cutpoint between Bin1 and Bin2. You can choose 3.25 as the cutpoint between Bin2 and Bin3. Then your cutpoints are {0.2, 1.75, 3.25, and 7.4}. The new columns is the bin number.
If you have further questions, post them and example data to the SAS Support Community.