When a categorical variable has dozens or hundreds of categories, it is often impractical and undesirable to create a bar chart that shows the counts for all categories. Two alternatives are popular:
- Display only the Top 10 or Top 20 categories. As I showed last week, to do this in SAS you can use PROC FREQ to tabulate and order the data, and then use the OBS= data set option to truncate the data. See the article "Create a bar chart with only a few categories" for details and SAS code.
- Display the Top 10 or Top 20 categories, but also aggregate the counts of the remaining categories to create a new "Others" category. This merging of small categories is done by default in some software, such as in SAS/IML Studio bar charts, and is very useful at the exploratory and model-building phases of data analysis. This bar chart was also available in the now-defunct SAS/INSIGHT product.
Preliminary step: Count and order the categories
As described in the previous article, you can use PROC FREQ to tabulate the counts of observations. The following statements count the number of different vehicles for car manufactures in the Sashelp.Cars data set. The FreqOut data set is sorted in descending order by the Count variable.
/* Combine small categories into an "Other" category; sum the counts */ %let VName = Make; /* character categorical variable */ proc freq data=sashelp.cars ORDER=FREQ noprint; tables &VName / out=FreqOut; run; |
Main step: Create the "Others" category by aggregating small categories
In order to create the new category, just sum the counts of the small categories. For example, if you intend to show the 20 largest categories, sum the counts of categories 21, 22, 23, and so forth. There are several ways to do this. For me, the SAS/IML language is to most compact:
/* aggregate counts; append new level "Others" to truncated categorical variable */
%let NumCats = 20; /* number of categories in bar chart */
proc iml;
varNames = {"&VName" "Count"};
/* read categories and counts */
use FreqOut; read all var varNames; close FreqOut;

/* sum up the counts for the smaller categories */
OtherCount = sum(Count[&NumCats+1:nrow(Count)]);
&VName = &VName[1:&NumCats] // "Others";  /* truncate and append "Others" */
Count  = Count[1:&NumCats] // OtherCount; /* truncate and append sum of small counts */

/* write new data set with the Top categories and "Others" */
create Other var varNames; append; close Other; |
The vertical concatenation operator (//) was used to append the "Others" category and counts to the Top 20. You can now create the bar chart by calling the SGPLOT procedure, as follows:
/* create bar chart that includes the "Others" category */ proc sgplot data=Other; title "Top &NumCats Vehicle Manufacturers and 'Others' Category"; hbar &VName / freq=Count; yaxis discreteorder=data; xaxis label = "Count" grid; run; |
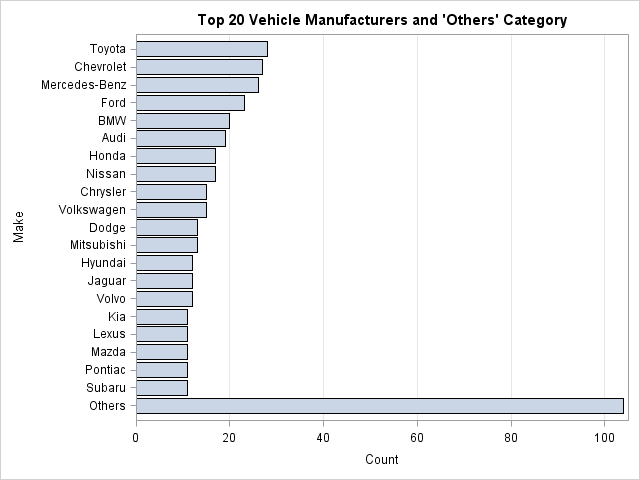
The graph shows that Toyota, Chevrolet, and other companies produce many different models, but that collectively the companies that manufacture 10 or fewer models produce more than 100 models. Advantages of the "Others" category include:
- You can see the relative size ("market share") of the Top 20 categories.
- You can plot percentages instead of counts, and the percentages will be correctly interpretable as a percentage of the whole.
- The graph shows all the data, so it is more honest than a graph that selectively shows only a portion of the data.
Other ways to compute the "Others" category
You could argue that using SAS/IML to add a series of numbers is overkill. However, when I tried to use the DATA step, I realized that I potentially need to change the length of the categorical variable. If the length of the categorical variable is less than six, the word "Others" gets truncated. I am not aware of any way to change the length of a character variable "dynamically" in the DATA step, whereas in PROC IML the concatenation operator ensures that c = c // "Others" always has space for at least six characters.
In the following code, I follow a suggestion made by Chris Hemedinger and create a macro variable that is always greater than or equal to six. That macro variable is then used in a LENGTH statement to ensure that the categorical variable can hold the string "Others":
/* DATA step approach */ /* 1. Check length of the category variable. Create macro variable . */ data _null_; dsid = open('sashelp.cars'); cur_len = varlen(dsid,varnum(dsid,"&VName")); /* length of categorical var */ rc = close(dsid); call symputx('len',max(cur_len, 6)); /* new length is always >= 6 */ run; /* 2. Keep first few obs; accumulate count of Others */ data Other2(keep=&VName Count); length &VName $ &len; /* make sure length >= 6 */ retain OtherCount; set FreqOut END=DONE; if _N_>&NumCats & ^DONE then do; /* sum up the counts for the smaller categories */ OtherCount + Count; delete; /* get rid of this observation */ end; if DONE then do; OtherCount + Count; &VName = "Others"; Count = OtherCount; /* append last obs */ end; run; |
The Others2 data set is identical to the Others data set that was created by PROC IML. However, my Base SAS implementation is not as compact as the SAS/IML version. Perhaps you can do better? Let me know in the comments.

3 Comments
Rick thanks for the example, just using DATA Step to assign the OTHERS for all the observations greater than &numCats, Proc SGPLOT will take care of summation
Yes, you are right! I guess I was thinking of ALSO making a report, but even in that case I can use your trick and use PROC FREQ to summarize. Great observation, thanks!
A colleague pointed out to me that the PARETO procedure in SAS/QC software can do the computations and make the chart without any pre-processing. Here's the example from this article:
There are other options that you can specify on the HBAR statement that control how the "Others" category is created. For details, see the documentation for the PARETO procedure