I previously described how to use Mahalanobis distance to find outliers in multivariate data. This article takes a closer look at Mahalanobis distance. A subsequent article will describe how you can compute Mahalanobis distance.
Distance in standard units
In statistics, we sometimes measure "nearness" or "farness" in terms of the scale of the data. Often "scale" means "standard deviation." For univariate data, we say that an observation that is one standard deviation from the mean is closer to the mean than an observation that is three standard deviations away. (You can also specify the distance between two observations by specifying how many standard deviations apart they are.)
For many distributions, such as the normal distribution, this choice of scale also makes a statement about probability. Specifically, it is more likely to observe an observation that is about one standard deviation from the mean than it is to observe one that is several standard deviations away. Why? Because the probability density function is higher near the mean and nearly zero as you move many standard deviations away.
For normally distributed data, you can specify the distance from the mean by computing the so-called z-score. For a value x, the z-score of x is the quantity z = (x-μ)/σ, where μ is the population mean and σ is the population standard deviation. This is a dimensionless quantity that you can interpret as the number of standard deviations that x is from the mean.
Distance is not always what it seems
You can generalize these ideas to the multivariate normal distribution. The following graph shows simulated bivariate normal data that is overlaid with prediction ellipses. The ellipses in the graph are the 10% (innermost), 20%, ..., and 90% (outermost) prediction ellipses for the bivariate normal distribution that generated the data. The prediction ellipses are contours of the bivariate normal density function. The probability density is high for ellipses near the origin, such as the 10% prediction ellipse. The density is low for ellipses are further away, such as the 90% prediction ellipse.
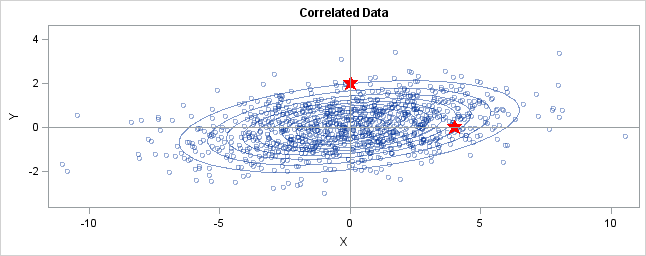
In the graph, two observations are displayed by using red stars as markers. The first observation is at the coordinates (4,0), whereas the second is at (0,2). The question is: which marker is closer to the origin? (The origin is the multivariate center of this distribution.)
The answer is, "It depends how you measure distance." The Euclidean distances are 4 and 2, respectively, so you might conclude that the point at (0,2) is closer to the origin. However, for this distribution, the variance in the Y direction is less than the variance in the X direction, so in some sense the point (0,2) is "more standard deviations" away from the origin than (4,0) is.
Notice the position of the two observations relative to the ellipses. The point (0,2) is located at the 90% prediction ellipse, whereas the point at (4,0) is located at about the 75% prediction ellipse. What does this mean? It means that the point at (4,0) is "closer" to the origin in the sense that you are more likely to observe an observation near (4,0) than to observe one near (0,2). The probability density is higher near (4,0) than it is near (0,2).
In this sense, prediction ellipses are a multivariate generalization of "units of standard deviation." You can use the bivariate probability contours to compare distances to the bivariate mean. A point p is closer than a point q if the contour that contains p is nested within the contour that contains q.
Defining the Mahalanobis distance
You can use the probability contours to define the Mahalanobis distance. The Mahalanobis distance has the following properties:
- It accounts for the fact that the variances in each direction are different.
- It accounts for the covariance between variables.
- It reduces to the familiar Euclidean distance for uncorrelated variables with unit variance.
For univariate normal data, the univariate z-score standardizes the distribution (so that it has mean 0 and unit variance) and gives a dimensionless quantity that specifies the distance from an observation to the mean in terms of the scale of the data. For multivariate normal data with mean μ and covariance matrix Σ, you can decorrelate the variables and standardize the distribution by applying the Cholesky transformation z = L-1(x - μ), where L is the Cholesky factor of Σ, Σ=LLT.
After transforming the data, you can compute the standard Euclidian distance from the point z to the origin. In order to get rid of square roots, I'll compute the square of the Euclidean distance, which is dist2(z,0) = zTz. This measures how far from the origin a point is, and it is the multivariate generalization of a z-score.
You can rewrite zTz in terms of the original correlated variables. The squared distance Mahal2(x,μ) is
= zT z
= (L-1(x - μ))T (L-1(x - μ))
= (x - μ)T (LLT)-1 (x - μ)
= (x - μ)T Σ -1 (x - μ)
The last formula is the definition of the squared Mahalanobis distance. The derivation uses several matrix identities such as (AB)T = BTAT,
(AB)-1 = B-1A-1, and (A-1)T = (AT)-1. Notice that if Σ is the identity matrix, then the Mahalanobis distance reduces to the standard Euclidean distance between x and μ.
The Mahalanobis distance accounts for the variance of each variable and the covariance between variables. Geometrically, it does this by transforming the data into standardized uncorrelated data and computing the ordinary Euclidean distance for the transformed data. In this way, the Mahalanobis distance is like a univariate z-score: it provides a way to measure distances that takes into account the scale of the data.

101 Comments
Pingback: How to compute Mahalanobis distance in SAS - The DO Loop
Thanks! I was reading about clustering recently and there was a little bit about how to calculate the mahalanobis distance, but this provides a much more intuitive feel for what it actually *means*.
is this better than wikipedia?
definitely..
Semi definitely
Pingback: The curse of dimensionality: How to define outliers in high-dimensional data? - The DO Loop
Pingback: Testing data for multivariate normality - The DO Loop
Great entry! Thanks.
Great Article. Thanks for your effort
Pingback: Compute the multivariate normal denstity in SAS - The DO Loop
sir, I have calculate MD of 20 vectors each having 9 elements for ex.[1 2 3 3 2 1 2 1 3] using the formula available in the literature. I got 20 values of MD [2.6 10 3 -6.4 9.5 0.4 10.9 10.5 5.8,6.2,17.4,7.4,27.6,24.7,2.6,2.6,2.6,1.75,2.6,2.6]. Actually I wanted to calculate divergence. Can you please help me to understand how to interpret these results and represent graphically.
Thanking you
I suggest you post your question to the discussion forum at https://communities.sas.com/community/support-communities/sas_statistical_procedures and provide a link to your definition of "divergence."
Sir, can you elaborate the relation between Hotelling t-squared distribution and Mahalanobis Distance?
They are closely related. Mahalanobis distance is a way of measuring distance that accounts for correlation between variables. In multivariate hypothesis testing, the Mahalanobis distance is used to construct test statistics. For example, if you have a random sample and you hypothesize that the multivariate mean of the population is mu0, it is natural to consider the Mahalanobis distance between xbar (the sample mean) and mu0. This is an example of a Hotelling T-square statistic. By knowing the sampling distribution of the test statistic, you can determine whether or not it is reasonable to conclude that the data are a random sample from a population with mean mu0.
There are other T-square statistics that arise. For example, there is a T-square statistic for testing whether two groups have the same mean, which is a multivariate generalization of the two-sample t-test. All of the T-square statistics use the Mahalanobis distance to compute the quantities that are being compared.
Sir please explain the difference and the relationships betweeen euclidean and mahalanobis distance
Mahalanobis distance adjusts for correlation. To measure the Mahalanobis distance between two points, you first apply a linear transformation that "uncorrelates" the data, and then you measure the Euclidean distance of the transformed points.
how to determine euclidean distance??
The usual way: the square root of the sum of the squares of the differences between coordinates dist(p,q)=||p-q||.
See http://en.wikipedia.org/wiki/Euclidean_distance. In SAS, you can use PROC DISTANCE to calculate the Euclidean distance.
Don't you mean "like a MULTIVARIATE z-score" in your last sentence. Apologies for the pedantry.
Thomas
Math is a pedantic discipline. I welcome the feedback. I think the sentence is okay because I am comparing the Mahal distance to the concept of a univariate z-score. Therefore it is LIKE a univariate z-score. As you say, I could have written it differently. How about we agree that it is the "multivariate analog of a z-score"?
This is much better than Wikipedia. How did you generate the plot with the prediction ellipses? How did you convert the Mahalanobis distances to P-values? Do you have some sample data and a tutorial somewhere on how to generate the plot with the ellipses?
Hi,
In the context of clustering, lets say k-means, when we want to calculate the distance of a given point from a given cluster which one of the following is suggested:
1. calculate the covariance matrix of the whole data once and use the transformed data with euclidean distance?
or
2. each time we want to calculate the distance of a point from a given cluster, calculate the covariance matrix of that cluster and then compute the distance?
I hope I could convey my question. for I'm working on my project, which is a neuronal data, and I want to compare the result from k-means when euclidean distance is used with k-means when mahalanobis distance is used.
Thanks in advance.
The first option is simpler and assumes that the covaraince is equal for all clusters. The second option assumes that each cluster has it's own covariance. A third option is to consider the "popoled" covariance, which is an average of the covariances for each cluster. It all depends on how you want to model your data. These options are discussed in the documentation for PROC CANDISC and PROC DISCRIM. Look at the Iris example in PROC CANDISC and read about the POOL= option in PROC DISCRIM.
Nice...Thanks for such a nice tutorial
Pingback: The best of SAS blogs for 2012 - SAS Voices
Pingback: 12 Tips for SAS Statistical Programmers - The DO Loop
At the end, you take the squared distance to get rid of square roots. Since you had previously put the mahalanobis distance in the context of outlier detection, this reminded me of the least squares method, which seeks to minimize the sum of squared residuals. I've heard the "square" explained variously as a way to put special emphasize on large deviations in single points over small deviations in many, or explained as a way to get a favourable convex property of the minimization problem. Are any of these explanations correct and/or worth keeping in mind when working with the mahalanobis distance?
Yes. In the least squares context, the sum of the squared errors is actually the squared (Euclidean) distance between the observed response (y) and the predicted response (y_hat). In both contexts, we say that a distance is "large" if it is large in any one component (dimension).
Thanks. It is very useful to me. Can use Mahala. distance as z-score feed into probability function ChiSquareDensity to calculate probability?
Thanks.
Kind of. Two common uses for the Mahalanobis distance are
1) For MVN data, the square of the Mahalanobis distance is asymptotically distributed as a chi-square. See the article "Testing Data for Multivariate Normality" for details.
2) You can use Mahalanobis distance to detect multivariate outliers.
In both of these applications, you use the Mahalanobis distance in conjunction with the chi-square distribution function to draw conclusions.
Pingback: How to compute the distance between observations in SAS - The DO Loop
Hi Rick. Sorry for two basic questions. I have read that Mahalanobis distance theoretically requires input data to be Gaussian distributed. Is it just because it possess the inverse of the covariance matrix? Or is there any other reason? Second, it is said this technique is scale-invariant (wikipedia) but my experience is that this might only be possible with Gaussian data and that since real data is generally not Gaussian distributed, scale-variance feature does not hold? Please comment. Thanks
I think these are great questions (and not basic). From a theoretical point of view, MD is just a way of measuring distances. You choose any covariance matrix, and then measure distance by using a weighted sum of squares formula that involves the inverse covariance matrix. (The Euclidean distance is unweighted sum of squares, where the covariance matrix is the identity matrix.) So the definition of MD doesn't even refer to data, Gaussian or otherwise.
If you read my article "Use the Cholesky transformation to uncorrelate variables," you can understand how the MD works.
What makes MD useful is that IF your data are MVN(mu, Sigma) and also you use Sigma in the MD formula, then the MD has the geometric property that it is equivalent to first transforming the data so that they are uncorrelated, and then measuring the Euclidean distance in the transformed space.
So to answer your questions: (1) the MD doesn't require anything of the input data. However, it is a natural way to measure the distance between correlated MVN data. (2) The scale invariance only applies when choosing the covariance matrix. If you change the scale of your variables, then the covariance matrix also changes. If you measure MD by using the new covariance matrix to measure the new (rescaled) data, you get the same answer as if you used the original covariance matrix to measure the original data.
Thanks a lot for your prompt response. Appreciate your posts
Sir, Im trying to develop a calibration model for near infrared analysis, and Im required to plug in a Mahalanobis distance that will be used for prediction of my model, however, im stuck as I dont know where to start, can you give a help on how can i use mahalanobis formula?
If you use SAS software, you can see my article on how to compute Mahalanobis distance in SAS. Other SAS procedures, such as PROC DISCRIM, also use MD. If you do not use SAS, I suggest you ask your research supervisor for more details about how to implement his suggestion.
Hello,
I have read couple of article that says If the M-distance value is less than 3.0 then the sample is represented in the calibration model, if the M-distance value is greater than 3.0, this indicates that the sample is not well represented by the model, so how did they come up with this limitation?
Each observation in the data has a distance from it to the sample mean. If the data are truly
MVN data, the Mahalanobis distance follows a known distribution (the chi distribution), so you can figure out how large the distance should be in MVN data. This idea can be used to construct goodness-of-fit tests for whether a sample can be modeled as MVN.
thank you very much! It made my night! :)
The funny thing is that the time now is around 4 in the morning and when I started reading I was too asleep. But now, I am quite excited about how great was the idea of mahalanobis distance and how beautiful is it! All this sense is because of your clear and great explanation of the method. Many thanks!
How to derive mahalanobis distribution?
This is a classical result, probably known to Pearson and Mahalanobis. For a modern derivation, see R.A. Johnson and D.W. Wichern, Applied Multivariate Statistical Analysis (3rd Ed), 1992, p. 140, which shows that if X is p-dimensional MVN(mu, Sigma), then the squared Mahalanobis distances for X are distributed as chi-square with p derees of freedom. The result is approximately true (see 160) for a finite sample with estimated mean and covariance provided that n-p is large enough.
If I compare a cluster of points to itself (so, comparing identical datasets), and the value is e.g. 2.2. Can I say that a point is on average 2.2 standard deviations away from the centroid of the cluster?
Actually, there is no real mean or centroid determined, right? Mahalanobis distance is only defined on two points, so only pairwise distances are calculated, no?
You can compute an estimate of multivariate location (mean, centroid, etc) and compute the Mahalanobis distance from observations to that point. The statement "the average Mahalanobis distance from the centroid is 2.2" makes perfect sense.
Thx for the reply. Does this statement makes sense after the calculation you describe, or also with e.g. 100 vs. 100 pairwise comparisons? I guess both, only in the latter, the centroid is not calculated, so the statement is not precise... .
I think calculating pairwise MDs makes mathematical sense, but it might not be useful. The MD is a generalization of a z-score. In 1-D, you say z_i = (x_i - mu)/sigma to standardize a set of univariate data, and the standardized distance to the center of the data is d_i = |x_i-mu|/sigma. What you are proposing would be analogous to looking at the pairwise distances d_ij = |x_i - x_j|/sigma.
Well, I guess there are two different ways to calculate mahalanobis distance between two clusters of data like you explain above, but to be sure we are talking about the same thing, I list them below:
1) you compare each data point from your sample set to mu and sigma matrices calculated from your reference distribution (although labeling one cluster sample set and the other reference distribution may be arbitrary), thereby calculating the distance from each point to this so called mahalanobis-centroid of the reference distribution.
2) you compare each datapoint from matrix Y to each datapoint of matrix X, with, X the reference distribution (mu and sigma are calculated from X only)
The values of the distances will be different, but I guess the ordinal order of dissimilarity between clusters is preserved when using either method 1 or 2. I actually wonder when comparing 10 different clusters to a reference matrix X, or to each other, if the order of the dissimilarities would differ using method 1 or method 2. Also, I can't imagine a situation where one method would be wrong and the other not. Althought method one seems more intuitive in some situations.
Details on calculation are listed here: http://stackoverflow.com/questions/19933883/mahalanobis-distance-in-matlab-pdist2-vs-mahal-function/19936086#19936086.
I tested both methods, and they gave very similar results for me, the ordinal order is preserved, and even the relative difference between cluster dissimilarity seems to be similar for both methods.
I have seen several papers across very different fields use PCA to reduce a highly correlated set of variables observed for n individuals, extract individual factor scores for components with eigenvalues>1, and use the factor scores as new, uncorrelated variables in the calculation of a Mahalanobis distance. The purpose of data reduction is two-fold, it identities relevant commonalities among the raw data variables and gives a better sense of anatomy, and it reduces the number of variables sothat the within-sample cov matrices are not singular due to p being greater than n. Is this appropriate?
I understand that the new PCs are uncorrelated but this is ACROSS populations. The within-population cov matrices should still maintain correlation. Results seem to work out (that is, make sense in the context of the problem) but I have seen little documentation for doing this. I understand from the above that a Euclidean distance using all PCs would be equivalent to the Mahalanobis distance but it sometimes isn't clear that using the PCs with very small eigenvalues is desirable. Thanks
Since the distance is a sum of squares, the PCA method approximates the distance by using the sum of squares of the first k components, where k < p. Provided that most of the variation is in the first k PCs, the approximation is good, but it is still an approximations, whereas the MD is exact.
Hi Rick..
I have Data set of 10000 observations and 10 parameters so as have centroid for each parameter. Now I want to calculate Mahalanobis Distance for each observation and assign probability. As per my understanding there are two ways to do so, 1. Using Principal Component & 2. using Hat Matrix. For my scenario i cant use hat matrix. And I find Principle component method little tidious.
Is there any other way to do the same using SAS?
Need your help..
Regards,
Deepa.
Sure. Post your question to the SAS Support Community for statistical procedures.
How to apply the concept of mahalanobis distance in self organizing maps.
That's a very broad question. I did an internet search and obtained many results. See if this paper provides the kind of answers you are looking for.
Suppose I wanted to define an isotropic normal distribution for the point (4,0) in your example for which 2 std devs touch 2 std devs of the plotted distribution. How could I proceed to find the std dev of my new distribution? It seems to be related to the MD.
I don't understand what "touching" means, even in the case of univariate distributions. Do you mean that the centers are 2 (or 4?) MD units apart?
Thanks, already solved the problem, my hypothesis was correct.
Pingback: Computing prediction ellipses from a covariance matrix - The DO Loop
I read lot of articles that say If the M-distance value is less than 3.0 then the sample is represented in the calibration model. And if the M-distance value is greater than 3.0, this indicates that the sample is not well represented by the model.
What is the explanation which justify this threshold ?
Thanks,
Cecile
As explained in the article, if the data are MVN, then the Cholesky transformation removes the correlation and transforms the data into independent standardized normal variables. For a standardized normal variable, an observation is often considered to be an outlier if it is more than 3 units away from the origin. The value 3.0 is only a convention, but it is used because 99.7% of the observations in a standard normal distribution are within 3 units of the origin.
Hi Rick,
I've read about Mahalanobis-Taguchi System (MTS), a pattern recognition tool developed by the late Dr. Genichi Taguchi based on MD formulation. In MTS methodology, the standard MD formulation is divided by number of variables/attributes/items of your sample denoted as 'k'.
In many books, they explain that this scaling/dividing by 'k' term will read out the MD scale as the mean square deviation (MSD) in multidimensional space. Why is that so? And what is your view on this MTS concept in general?
Thanks in advance.
I've never heard of this before, so I don't have a view on the concept in general. As to "why," the squared MD is just the sum of squares from the mean. Therefore if you divide by k you get a "mean squared deviation." However, notice that this differs from the usual MSD for regression residuals: in regression you would divide by N, not k.
Hi Rick,
I have a multivariate dataset representing multiple locations, each of which has a set of reference observations and a single test observation. For each location, I would like to measure how anomalous the test observation is relative to the reference distribution, using the Mahalanobis distance. Then I would like to compare these Mahalanobis distances to evaluate which locations have the most abnormal test observations.
My question is: is it valid to compare Mahalanobis distances that were generated using different reference distributions? I have only ever seen it used to compare test observations relative to a single common reference distribution. The data for each of my locations is structurally identical (same variables and number of observations) but the values and covariances differ, which would make the principal components different for each location.
Thanks!
You might want to consult with a statistician at your company/university and show him/her more details. From what you have said, I think the answer will be "yes, you can do this." Consider the analogous 1-D situation: you have many univariate normal samples, each with one test observation. You can use the "reference observations" in the sample to estimate the mean and variance of the normal distribution for each sample. You then compute a z-score for each test observation. The z-score tells you how far each test obs is from its own sample mean, taking into account the variance of each sample.
I have already posted a question on SAS/STAT community website .
I would like t 'weight' first few principal components more heavily, as they capture the bulk of variance. Would the weight option in the var statement of Proc Distance, accomplish the goal? Is there any rational justification for using weights?
Thanks, RT.
Principal components are already weighted. The PCs are eigenvectors and the associated eigenvalues represent the square root of the total variance explained by each PC. That is the basis for the scree plot, in which you use eigenvalues to determine how many PCs you need to keep to capture the bulk of the variance.
Sir,How is getting the covariance matrix?
please reply soon
In SAS, you can use PROC CORR to compute a covariance matrix.
Nice article. Very clear.
Thanks
Dear Rick,
Thanks for your helpful article.
I have one question regarding the literature you use.
In which book can I find the derivation from z'z to the definition of the squared mahalanobis distance?
Appreciate your help.
I am not aware of any book that explicitly writes out those steps, which is why I wrote them down. I do not see it in any of the books on my reference shelf, nor in any of my multivariate statistics textbooks (eg, Johnson & Wichern), although the ideas are certainly present and are well known to researchers in multivariate statistics. Maybe you could find it in a textbook that discusses Hotelling's T^2 statistic, which uses the same computation. If you can't find it in print, you can always cite my blog, which has been cited in many books, papers, and even by Wikipedia.
prove it: AT wΣAw = I
I guess there is a mistake.
"However, for this distribution, the variance in the Y direction is LESS than the variance in the X direction, so in some sense the point (0,2) is "more standard deviations" away from the origin than (4,0) is."
In this fragment, should say "...the variance in the Y direction is MORE than the variance ...."?
Good Reading
Thnks for the comment. A think the text is correct. If you look at the scatter plot, the Y-values of the data are mostly in the interval [-3,3]. In contrast, the X-values of the data are in the interval [-10, 10]. Both means are at 0. Thus the variance in the Y coordinate is less than the variance in the X coordinate.
Great article. It would be great if you can add a plot with Standardised quantities too. And then asked the same question again. As in which point is near to origin.
Thanks for your comment. The plot of the standardized variables looks exactly the same except for the values of the tick marks on the axes. The more interesting image is the geometry of the Cholesky transformation, which standardizes and "uncorrelates" the variables.
Dear Rick,
Thanks for your helpful article.
I have one question regarding the distribution of the squared Mahalanobis distance.
As stated in your article 'Testing data for multivariate normality', the squared Mahalanobis distance has an approximate chi-squared distribution when the data are MVN.
In my case, I have normally-distributed random variables which are highly correlated with each other. If I plot two of them, the data points lie somehow around a straight line.
My first idea was to interpret the data cloud as a very elongated ellipse which somehow would justify the assumption of MVN.
Next, as described in the article 'Detecting outliers in SAS: Part 3: Multivariate location and scatter', I would base my outlier detection on the critical values of the chi-squared distribution.
Is this approach reasonable?
Because I always struggle with the definition of the chi-square distribution which is based on independent random variables.
Appreciate your help.
Theoretically, your approach sounds reasonable. The MD computes the distance based on transformed data, which are uncorrelated and standardized. As long as the data are non-degenerate (that is, the p RVs span p dimensions), the distances should follow a chi-square(p) distribution (assuming MVN).
Thanks for your answer.
As a consequence, is the following statement correct?
I can reject the assumption of an underlying multivariate normal distribution if I display the histograms ('proc univariate') of the score values for the first principal components ('proc princomp') and at least one indicates non-normality.
Appreciate your help.
I have written about several ways to test data for multivariate normality. Use one of those multivariate tests on the PCA scores, not a univariate test.
Thanks for entry!
I wonder what if the data is not normal. That means, I cannot use Mahalanobis distance at all?
That's an excellent question. The definition makes sense for any data distribution, so you can always compute the Mahalanobis distance. However, certain distributional properties of the distance are valid only when the data are MVN. (In particular, the distribution of MD is chi-square for MVN data.) Also, the covariance matrix (and therefore the MD) is influenced by outliers, so if the data are from a heavy-tailed distribution the MD will be affected.
Hi Rick - thank you very much for the article! I’ve also read all the comments and felt many of them have been well explained. I do have a question regarding PCA and MD. I am working on a project that I am thinking to calculate the distance of each point. It is high dimensional data.
1) Can I use PCA to reduce to two dimensions first and apply MD? It seems that PCA will remove the correlation between variables, so is it the same just to calculate the Euclidean distance between mean and each point?
2) what is the difference between PCA and MD? You mentioned PCA is approximation while MD is exact. Can you elaborate that a little bit more?
I suggest you post your question to a statistical discussion forum where you can explain further what you are trying to attempt. It is not clear to me what distances you are trying to compute. PCA is usually defined as dropping the smallest components and keeping the k largest components. So any distance you compute in that k-dimensional space is an approximation of distance in the original data.
Very desperate, trying to get an assignment in and don't understand it at all, if someone can explain please?
If the data reveals, the MD value is 12 SD’s away from a standardized residual of 2.14. What conclusions would you draw regarding these results and what action would you take. ? Id greatly appreciate some help. Please, Thanks you
Whenever I am trying to figure out a multivariate result, I try to translate it into the analogous univariate problem. By solving the 1-D problem, I often gain a better understanding of the multivariate problem. The next thing I try is to understand/solve the problem for multivariate data that have a diagonal covariance matrix σ^2 I.
Dear Dr. Rick Wicklin,
Thank you for sharing this great article!
I have one question: the data set is 30 by 4. For observation 1, Mahalanobis distance=16.85, while for observation 4 MD=12.26. However, as measured by the z-scores, observation 4 is more distant than observation 1 in each of the individual component variables. Z scores for observation 1 in 4 variables are 0.1, 1.3, -1.1, -1.4, respectively. Z scores for observation 4 in 4 variables are 3.3, 3.3, 3.0 and 2.7, respectively. Could you please account for this situation?
By reading your article, I know MD accounts for correlation between variables, while z score doesn't. Does it happen because the correlation of z scores for observation 4 is high, while the correlation of z scores for observation 1 is not?
Thank you so much for your help!
You've got the right idea. For multivariate correlated data, the univariate z scores do not tell the complete picture. You can have observations with moderate z scores in all the components, but the combination of values is unusual. For example, a student might be moderately short and moderately overweight, but have basketball skills that put him in the 75th percentile of players. Although none of the student's features are extreme, the combination of values makes him an outlier.
Pingback: The geometry of multivariate versus univariate outliers - The DO Loop
sir how to find Mahalanobis distance in dissolution data.
thanks,
Rahul
can you please explain why Mahalanobis distance can exclude correlation samples ?
Sorry, but I do not understand your question. The MD is a way to measure distance in correlated data.
The word "exclude" is sometimes used when talking about detecting outliers. The MD can be used to detect outliers. They are observations that have a large MD from the center of data. See "The geometry of multivariate outliers."
Dear Rick, I have a bivariate dataset which is classified into two groups - yes and no. I'm trying to determine which group a new observation should belong based on the shorter Mahalanobis distance. The data is univariately normal for both variables but highly correlated (pearson correlation is 0.88) and therefore fails MVN test. The two groups have different means and variance. Is it valid to compare the Mahalanobis distance of the new observation from both groups, in order to assign it to one of the groups? If not, can you please let me know any workaround to classify the new observation? Eg use cholesky transformation
I forgot to mention that the No group is extremely small compared to the Yes group, only about 3-5 percent of all observations in the combined dataset. When trying to assign a new observation to one of the groups I didn't want to use a logistic regression because I was afraid the no group would be considered as outliers, this is why I thought of using Mahalanobis distance.
This sounds like a classic discrimination problem. You want to assign the new point to the group (Yes or No) that it is most like, based on prior labeled data. Many discriminant algorithms use the Mahalanobis distance, or you can use logistic regression, which would be my choice. Although you could do it "by hand," you would be better off using a conventional algorithm. If you need help, post your question and sample data to the SAS Support Communities.
Rick, thanks for the reply. I'll ask on community, but can I ask a quick question here? I didnt want to use logistic regression since the data is not accounting for much of the variance due to missing information. I just want to know, given the two variables I have, to which of the two groups is a new observation more likely to belong to? So is it valid to compare MDs when the two groups Yes and No have different covariance and mean?
It's not a simple yes/no answer. The answer can be "yes," provided that:
1. The clusters are approximately MV normal
2. You compute the MD using the appropriate group statistics.
The MD from the new obs to the first center is based on the sample mean and covariance matrix of the first group. The MD to the second center is based on the sample mean and covariance of the second group. If you think the groups have a common covariance, you can estimate it by using a pooled covariance matrix. For the geometry, discussion, and computations, see "Pooled, within-group, and between-group covariance matrices."
Thank you very much Rick
Thank you very much Rick. This post and that of the Cholesky transformation helped me very much for a clustering I have been doing. I need to give a reference for a paper, and I was wondering if you could indicate a reference of a publication to refer to for indicating that "The Euclidean distance calculated on the dataset Y is equivalent to the Mahalanobis distance calculated in X." (Here, Y is the data scaled with the inverse of the Cholesky transformation).
Σ_X=LL^T
Y=XL^(-1)
Where Σ_X is the variance-covariance matrix of the environmental covariates sample X, L is the Cholesky factor of Σ_X, a lower triangular matrix with positive diagonal values, and Y is the rescaled covariates dataset.
Have you got any reference I could cite? Thanks in advance.
This article is referenced by Wikipedia, so it is suitable as a reference:
Wicklin, Rick. (2012). What is Mahalanobis Distance?. Retrieved from https://blogs.sas.com/content/iml/2012/02/15/what-is-mahalanobis-distance.html
I do not have access to the SAS statistical library because of the pandemic, but I would guess you can find similar information in a text on multivariate statistics.
Hello Rick,
That is great. I will provide this as reference :)
Thank you very much.
Kind regards,