Since this is a blog about statistical programming and analysis, I am always looking for data to analyze. As 2011 ends, I look back on the 165 blog entries that I published since 01JAN2011. This article presents the 10 most popular posts, as determined by the number of people who viewed each entry. (When totaling the counts, I excluded readers from the sas.com domain.)
Posts that were published earlier in the year have a greater chance of appearing on the list. However, I did not normalize the data by the length of time since the article first appeared. Here, then, are the most-viewed articles of 2011:
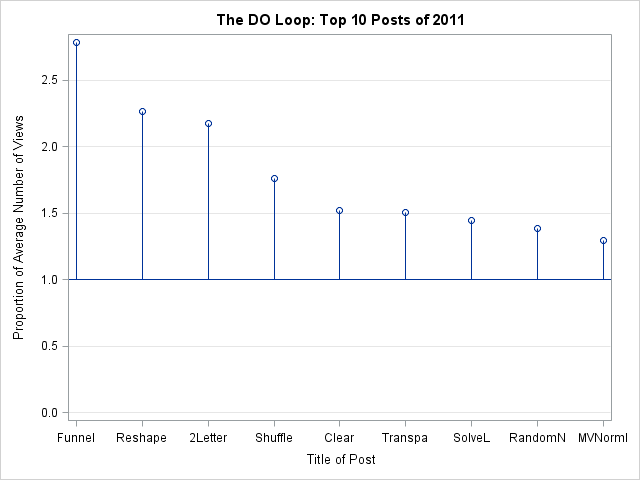
- How to create funnel plots in SAS: This article is part of a series that describes how to create funnel plots in SAS.
- Reshaping data from wide to long format: A short post on how to use PROC TRANSPOSE to reshape data.
- Two-Letter initials: Which are the most common? I'm so glad this article made the list! It was extremely fun to write, as was the follow-up article on the probability that a two people in a room of 20 have the same initials. This article is the source of the orange, green, blue, and cream logo at the top of my blog.
- Estimating popularity based on Google searches: Why it's a bad idea: This article received the most comments in the past year. The summary: statisticians at Google don't use the number of Google hits to estimate popularity, and neither should you.
- A statistical model of card shuffling: It's interesting to build a statistical model of a riffle shuffle. Even more interesting, you can simulate a riffle shuffle efficiently with a simple piecewise linear model. Who knew?
- How to clear the output window in SAS 9.3: When you run SAS 9.3 in the windowing environment, HTML is the default output destination. This article describes how to clear the tables and graphics in the HTML destination.
- How to use transparency to overcome overplotting: Using semi-transparent markers is a simple trick that sometimes helps deal with overplotting in scatter plots. Another technique is to jitter the points in a scatter plot.
- Solving linear systems: Which technique is fastest? In this article I explicitly show that solving a specific linear system is about four times faster than solving for a general inverse. This article also inspired the popular article, "What is the chance that a random matrix is singular?"
- How to generate random numbers in SAS? All about using the RAND function to generate random values. This article inspired the follow-up article, "Random number streams in SAS: How do they work?"
- Sampling from the multivariate normal distribution: This article describes how to obtain correlated multivariate normal vectors in SAS.
The following chart shows the popularity of each post, relative to the average post was. (The average is represented by the reference line at 1.) You can see that the first few entries were read more than twice as much as my average post. The #10 post was read about 1.3 times more than the average.
proc sgplot data=a; title "The DO Loop: Top 10 Posts of 2011"; needle x= Title y=Percent / markers baseline=1; yaxis min=0 grid label="Proportion of Average Number of Views"; xaxis label="Title of Post"; run; |
I think these posts are representative of my blog: an eclectic mix of data analysis, simulation, statistical programming, and tips on how to use SAS efficiently.
Readers, which posts did you find the most interesting or the most useful? What topics would you like to see more of in the coming year? Post a comment.

6 Comments
@Rick -- Thanks a lot for this wonderful summation at then end of the year: I really enjoy these 10 posts. Hope to see your research about how to do simulation by PROC COPULA.
Hello, Rick!
I am wondering if your data include visits through RSS readers? Out those 10 I really liked the posts about shuffling and transparency.
No, these do not include readers through RSS. Only those who actually click on the title of the post. If you are just viewing the feed, you can scroll to a dozen different posts, so I have no idea which ones are being read. Those views get recorded as a general view of "blogs.sas.com/content/iml."
Pingback: New 2012 resolutions for my blog - The DO Loop
So, if someone comments on a prior post Rick how are you going to include it in your numbers? Does it show as a current year posting, or does it simply drop into the ether on the internet?
Of course, backdated transactions is an item that I suffer from greatly in my business reporting, so I am just fishing for opinions/views!
In practice, it doesn't happen often. After about a month, posts don't receive many comments. I won't be revising the numbers, so as far as counting them, I guess comments on old posts "vanish in the ether."