A colleague related the following story: He was taking notes at a meeting that was attended by a fairly large group of people (about 20). As each person made a comment or presented information, he recorded the two-letter initials of the person who spoke. After the meeting was over, he was surprised to discover that all of the initials of the people in the room were unique! Nowhere in his notes did he write "JS said..." and later wonder "Was that Jim Smith or Joyce Simpson?"
My colleague asked, "If 20 random people are in a room, do they usually have different initials or is it common for two people to share a pair of initials?" In other words, was his experience typical or a rare occurrence?
The Distribution of Initials at a Large US Software Company
In order to answer that question, it is necessary to know the distribution of initials in his workplace.
Clearly, the distribution of initials depends on the population of the people in the workplace. In some cultures, names that begin with X or Q are rare, whereas in other cultures names that begin with those letters (when phonetically translated into English) are more common.
SAS is a large US software company with a diverse base of employees, so I decided to download the names of 4,502 employees that work with me in Cary, NC, and write a DATA step program that extracts the first and last initials of each name.
You can use the FREQ procedure to compute the frequencies of the first initial (I1), the last initial (I2), and the frequency of the initials taken as a pair. The following statements output the frequency of the initials in decreasing order:
proc freq data=Employees order=freq; tables I1 / out=I1Freq; tables I2 / out=I2Freq; tables I1*I2 / out=InitialFreq missing sparse noprint; run; |
As an example, I can display the relevant frequency for my initials (RW) as well as the initial of the SAS cofounders, Jim Goodnight and John Sall:
data SASUSER.InitialFreq; set InitialFreq; Initials = I1 || I2; run; proc print data=SASUSER.InitialFreq (where=(Initials="RW" | Initials="JG" | Initials="JS")); run; |
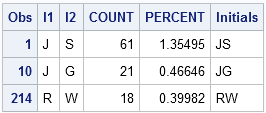
The initials "JS" are the most frequent initials in my workplace, with 61 employees (1.35%) having those initials. The initials "JG" are also fairly common; they are the 10th most popular initials. My initials are less common and are shared by only 0.4% of my colleagues.
If you want to conduct your own analysis, you can download a comma-separated file that contains the initials and frequencies.
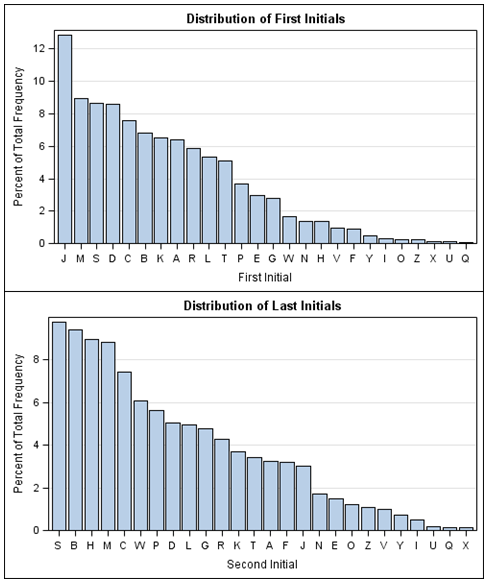
You can use PROC SGPLOT to display bar charts for the first and last initials.
The bar charts show that J, M, S, D, and C are the most common initials for first names, whereas S, B, H, M, and C are the most common initials for last names.
In contrast, U, Q, and X are initials that do not appear often for either first or last names. For first initials, the 10 least popular initials cumulatively occur less than 5% of the time. For last initials, the 10 least popular initials cumulatively occur about 8% of the time.
Clearly, the distribution of initials is far from uniform. However, for the note-taker, the important issue is the distribution of pairs of initials.
The Distribution of Two-Letter Initials
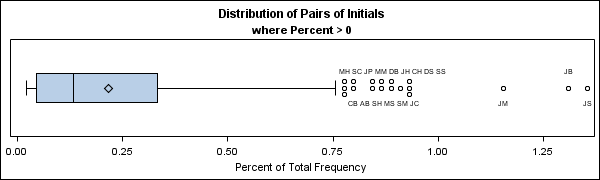
By using the PROC FREQ output, you can analyze the distribution at my workplace of the frequencies of the 262 = 676 pairs of initials:
- More than 30% of the frequencies are zero. For example, there is no one at my workplace with initials YV, XU, or QX.
- If you ignore the initials that do not appear, then the quantiles of the remaining observations are as follows:
- The lower quartile is 0.044.
- The median is 0.133.
- The upper quartile is 0.333.
- Three pairs are much more prevalent than the others. The initials JM, JB, an JS each occur more than 1% of the time.
The distribution of two-letter initials is summarized by the following box plot:
Visualizing the Proportions of Two-Letter Initials
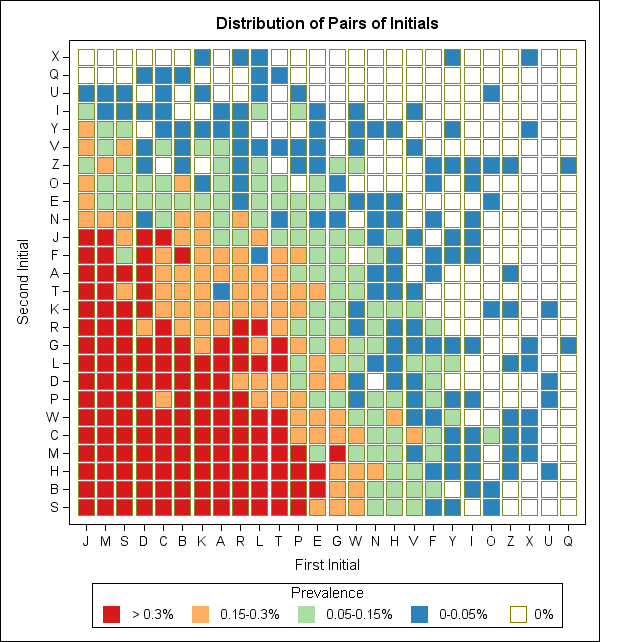
With the help of a SAS Global Forum paper that shows how to use PROC SGPLOT to create a heat map, I created a plot that shows the distribution of two-letter initials in my workplace.
When I create a heat map, I often use the quartiles of the response variable to color the cells in the heat map. For these data, I used five colors: white to indicate pairs of initials that are not represented at my workplace, and a blue-to-red color scheme (obtained from colorbrewer.org) to indicate the quartiles of the remaining pairs. Blue indicates pairs of initials that are uncommon, and red indicates pairs that occur frequently.
In terms of counts, blue indicates pairs of initials that are shared by either one or two individuals, and red indicates 18 or more individuals.
The heat map shows several interesting features of the distribution of pairs of initials:
- Although W and N are not unusual first initials (1.7% and 1.4%, respectively) and D and F are not unusual last initials (5.0% and 3.2%, respectively), there is no one at my workplace with the initials ND or WF.
- There are 89 individuals at my workplace who have a unique pair of initials, including YX, XX, and QZ.
You can download the SAS program that is used to produce the analysis in this article.
The Probability of Matching Initials
Computing the probability that a group of people have similar characteristics is called a "birthday-matching problem" because the most famous example is "If there are N people in a room, what is the chance that two of them have the same birthday?"
In Chapter 13 of my book, Statistical Programming with SAS/IML Software, I examine the birthday-matching problem. I review the well-known solution under the usual assumption that birthdays are uniformly distributed throughout the year, but then go on to compare that solution to the more realistic case in which birthdays are distributed in a fashion that is consistent with empirical birth data from the National Center for Health Statistics (NCHS).
Obviously, you can do a similar analysis for the "initial-matching problem." Specifically, you can use the actual distribution of initials at SAS to investigate the question, "What is the chance that two people in a room of 20 randomly chosen SAS employees share initials?" Come back next Wednesday to find out the answer!
WANT MORE GREAT INSIGHTS MONTHLY? | SUBSCRIBE TO THE SAS TECH REPORT

15 Comments
I am just wondering if there is any reason for you to use the where= ds option here.
proc print data=SASUSER.InitialFreq
(where=(Initials="RW" | Initials="JG" | Initials="JS"));
run;
Isn't it much more natural to just use where statement, like this?
proc print data=sashelp.class;
where name in ("Alfred", "Mary");
run;
No reason. I could have used a WHERE statement in the PROC:
where Initials in ("RW","JG","JS");
When a single data set is named, it makes absolutely no difference whether one uses WHERE as a DS option or as a statement. On the other hand, if data originate from two or more data sets, the use of WHERE as a DS option or as a statement can make a difference.
When used as a statement, the WHERE condition applies to all input data sets. If the WHERE condition should apply to all data sets, you may use the WHERE statement or WHERE as a DS option. However, it makes more readable code (IMO) to use a WHERE statement when the same condition applies to all sources. Of course, if different conditions apply to different data sets, then using WHERE as a DS option is required.
WHERE as a DS option is more flexible than a WHERE statement. For this reason, WHERE as a DS option is more prevalent in my own code than WHERE as a statement. Which is most prevalent in the population of SAS programmers, I do not know.
This is a great analysis and a great use of heatmaps.
We need to see more of these "fun" analyses, which are usually more of a R Stat venture, done in SAS.
Good work.
Thanks. I often do a "fun" analysis followed by a more rigorous treatment or variation. Other "fun" analyses I've done include the following:
http://blogs.sas.com/iml/index.php?/archives/63-Automating-the-Great-Christmas-Gift-Exchange.html
http://blogs.sas.com/iml/index.php?/archives/50-The-Statistics-of-My-Grocery-Bill.html
http://blogs.sas.com/iml/index.php?/archives/23-A-Statistical-Word-Puzzle!.html
http://blogs.sas.com/iml/index.php?/archives/55-How-Does-Participation-in-Social-Media-Vary-with-Age.html
Pingback: Visualizing Trends in the US Mobile Phone Industry - The DO Loop
Pingback: Hey! Those two people have the same initials! - The DO Loop
Pingback: Super Bowl pools and Roman numerals - The DO Loop
Pingback: Readers’ choice 2011: The DO Loop’s 10 most popular posts - The DO Loop
Cool! The 'Visualizing the Proportions of Two-Letter Initials' heat map is a great way to present the distribution of the initial pairs. You can definitely see that the more common the First Initial is independently, the more likely it is to be in a pair with another popular [independently, common] Last Initial.
In the last company I worked at, we used to refer to each other in memos using our initials - three letters where people had a middle name (most of them) or two if they didn't. Out of only about 30 employees, over the 14 years I was there, there were often clashes.
Perhaps this reflects a lack of diversity in ethnicity, with most of us having Anglo-Saxon names. There was also a high proportion of older employees, from a time when parents didn't choose from as wide a range of names as they do now.
I forgot the main reason I stumbled onto this old page. I just had to sort all of my current company's old phones into alphabetical order by surname. The Ms, Rs and Ss make up about half the pile.
This is good. Thank you
Dear Mr-MS
i have a question about letter group; how i can find them or what the equation put to give me letter group between data?
Thanks so much for this! I own an online stationery business and found this helpful for working out roughly how many pages to include for each letter when designing an address book. Obviously lots of assumptions there but better than just taking a stab in the dark!